Pontiac Wiki Pontiac Wiki

Quick Metrics

Quick Metrics

  • Advertiser Level Metrics
  • Line Item Level Metrics
  • Optimization Breakdowns
  • Creative Metrics
  • Standard Conversion Pixel Metrics
  • IP Conversion Pixel Metrics
  • Audience Metrics
  • Line Item Flight Metrics
  • Real Time Delivery
  • Line Item Performance Metrics
  • Audio/Video Metrics
  1. Home
  2. Origin Documentation
  3. Reporting
  4. Quick Metrics

Advertiser Level Metrics


Under the ‘Advertiser’ tab you will see a list of all of the ‘Active’ Advertisers in your seat with their associated quick metrics. To see ‘Inactive’ Advertisers filter status to ‘All’ or ‘Inactive’. These metrics are updated hourly with a 3 hour delay, except for the IP Convs which are updated once a day for the previous day.

Choose your ‘Reporting Interval’ and evaluate the following metrics at a glance:

  • Lines: The number of lines under this Advertiser.
  • Imps: Impressions served during the selected Reporting Interval.
  • Total Spend: Dollar amount this Advertiser has spent across all Lines during the selected Reporting Interval.
  • Clicks: Number of clicks across all Lines during the selected Reporting Interval.
  • Convs: Number of conversions (total of both post-view and post-click) across all Lines during the selected Reporting Interval.
  • IP Convs: Number of conversions registered by the IP Conversion Pixel across all Lines during the selected Reporting Interval. IP Conversion data is not available for the ‘Today’ interval. This metric is updated once a day for the previous day.

Line Item Level Metrics

In the ‘Advertiser’ tab each Advertiser can be expanded by clicking the arrow on the far left next to the green or red box. This will display all of the Line Items under the Advertiser and their associated quick metrics. These metrics are updated hourly with a 3 hour delay, except for the IP Convs which are updated once a day for the previous day.

Choose your ‘Reporting Interval’ and evaluate the following metrics at a glance:

  • Budget Type: Either impressions or spend.
  • Daily Budget: This will display either the dollar amount or the number of impressions that the Line will attempt to spend each day.
  • Total Budget: This will display either the dollar amount or the number of impressions that the Line will attempt to spend in the lifetime of the campaign.
  • Start Date
  • End Date
  • Splits: The number of optimizations that has been made to the Line Item.
  • Imps: Impressions served during the selected Reporting Interval.
  • Total Spend: Dollar amount this Line has spent during the selected Reporting Interval.
  • Clicks: Number of clicks this Line has received during the selected Reporting Interval.
  • Convs: Number of conversions (total of both post-view and post-click) this Line has received during the selected Reporting Interval. These are registered using the standard Conversion Pixel.
  • CPM: Cost per 1,000 ads.
  • CTR: Click through rate, this is the number of clicks divided by number of impressions during the selected Reporting Interval.
  • CPC: Cost per click, this is the total spend divided by the number of clicks during the selected Reporting Interval.
  • CPA: Cost per acquisition, this is the total spend divided by the number of conversions during the selected Reporting Interval.
  • IP Convs: Number of IP conversions this Line has received during the selected Reporting Interval. These are registered using the IP Conversion Pixel. This metric is not available for the ‘Today’ time interval. IP Convs are updated once a day for the previous day.

Optimization Breakdowns

The platform outlines all optimizations made, including all of the details that the AI more heavily targets or stops targeting, the dates that each change is made, and the amount of your Line’s budget that is reallocated toward the change. Users can see exactly when optimizations were made, including budget reallocation and details about the exchanges, locations, sellers, and placements that the sub-line exclusively targets or block lists. Through this, we guarantee full transparency in addition to quality. These metrics are updated hourly with a 3 hour delay.
Under the ‘Advertiser’ tab each Line Item can be expanded to display the optimization breakdown by clicking the arrow on the far left next to the green or red box. 

Choose your ‘Reporting Interval’ and evaluate the following metrics for each optimization:

  • Opt Base: This is the starting point for the campaign.
  • % Budget: For each optimization made to the campaign a % of the budget will be shown that is allocated to this change.
  • N_N_N_N:
    • N1 is Geo: Specific region this campaign targets (State/Province)
    • N2 is Domain: URL Domain. The domain(s) that the specific optimization is targeting
    • N3 is Exchange: Which exchanges this optimization is looking to buy through
    • N4 is Placement: The placement ID of where the campaign will serve on the specific domain

Creative Metrics

By clicking on the name and opening the specific page for an Advertiser or Line Item you can see quick metrics for each Creative. Creatives with a red box are inactive and Creatives with a green check-mark are active. By evaluating metrics at the Creative level, you can make decisions and optimize your campaign to serve the Creatives with the best performance. For example, if one Creative accounts for 70% of impressions, but only 10% of clicks, overall campaign performance may improve if you remove this Creative. These metrics are useful for A/B testing of different Creatives and provide valuable insight into the effectiveness of a Creative. These metrics are updated hourly with a 3 hour delay.

Choose your ‘Reporting Interval’ and evaluate the following metrics at a glance:

  • Audit Status: The audit status of each Creative will be displayed with a symbol. Hovering over this symbol will display a text box with additional details as to the status of this Creative, a yellow triangle for ‘audit pending’, a green check box for ‘passed audit’, a green triangle for ‘marked as sensitive’ and a red box for ‘rejected’. For more info on the audit process see here: Creative Audit.
  • Total Imps: The impressions this Creative has served during the selected Reporting Interval.
  • Total Spend: The dollar amount spent to serve this Creative during the selected Reporting Interval.
  • Total Clicks: The number of clicks this Creative has received during the selected Reporting Interval.
  • Total PcConvs: The number of post-click conversions this Creative has driven during the selected Reporting Interval.
  • Total PvConvs: The number of post-click conversions this Creative has driven during the selected Reporting Interval.
  • CTR: Click through rate, this is the number of clicks this Creative received divided by number of impressions this Creative has served during the selected Reporting Interval.

Standard Conversion Pixel Metrics

By opening the specific page for an Advertiser or Line Item you can see quick metrics for your Conversion pixels. These metrics are updated hourly with a 3 hour delay.

Choose your ‘Reporting Interval’ and evaluate the following metrics at a glance:

  • Trigger Type: Depending on how the pixel was configured this will display whether this pixel is triggered by a view, a click or a hybrid of both.
  • Total Loads: The number of times the pixel has been triggered in the selected Reporting Interval, this includes conversions that were not driven by Pontiac.
  • Total Convs: The number of conversions registered as a result of a Pontiac Ad in the selected Reporting Interval.
  • Total PcConvs: The number of post-click conversions registered as a result of a Pontiac ad in the selected Reporting Interval.
  • Total PvConvs: The number of post-view conversions registered as a result of a Pontiac ad in the selected Reporting Interval.

IP Conversion Pixel Metrics

At the Advertiser level, IP Conversion metrics will include conversions from ALL Line Items under this Advertiser, even if the pixel was not associated to the Line. If the pixel is associated to a Line Item, you can see metrics for that Line Item by opening the Line. Detailed reporting can be pulled in the Reporting tab under Custom Reports.

IP conversion pixels have a standard lookback of 30 days in the metrics under the Advertiser. This means that the user must complete the desired action within 30 days of seeing the ad for it to count as a conversion. If you would like to pull reporting with a custom lookback window, this can be done in Custom Reporting using the IP Conversion Custom Report. You can select from ‘5’, ‘7’, ’15’ or ’30’ day as the lookback.

Choose your ‘Reporting Interval’ and evaluate the following metrics at a glance:

  • Attributed Impressions: The number of impressions served by Pontiac campaigns to users that then converted.
  • Total Convs: The number of conversions, or unique actions that were driven by this campaign. A conversion event will be defined according to the pixel placement. For example, if the pixel is placed on all web pages, a conversion event would equal a page visit. If the pixel is placed on the ‘Thank you’ page after a purchase, then a conversion event would equal a purchase.
  • Total Loads: Total Loads will indicate the number of times the pixel has fired on the page, this is the number of users (not only those driven by Pontiac) that have visited the page in the selected time interval. If the pixel is showing 0 loads, this may indicate the pixel is not properly placed or firing correctly.
  • Uniques: The total number of unique visitors to the web page where the pixel is placed in the reporting interval selected.

To pull additional metrics or information from your IP Conversion Pixel, see here: IP Conversion Pixel Report

Audience Metrics

By clicking on the name and opening the specific page for an Advertiser you can see quick metrics for your First-Party Audience segments. These metrics are updated hourly with a 3 hour delay.

Choose your ‘Reporting Interval’ and evaluate the following metrics at a glance:

  • Type: ‘First Party’ indicates an Audience housed in the Pontiac platform, ‘Third-Party’ and ‘Onboarded’ indicate data from an external provider.
  • Total Loads:  This is the number of times the Remarketing pixel has been triggered during the selected Reporting Interval. This indicates the number of times the page where the pixel is placed has been loaded/viewed.
  • Avg. Daily Uniques: This will display the average number of daily unique visitors to the page where the pixel is placed within the selected Reporting Interval.
  • Avg. New Users: This is the average number of visitors per day that were new visitors to the site in the last 30 days.

Line Item Flight Metrics


Upon clicking on and opening a Line Item you will see a section called ‘Flight Metrics’ above the configuration menu. This section will display metrics for the line from start date to ‘yesterday’, changing the Reporting Interval will not change these metrics. These metrics are updated hourly with a 3 hour delay.

Choose your ‘Reporting Interval’ and evaluate the following metrics at a glance:

  • Clicks: The number of clicks in the lifetime of the Line.
  • Budget Type: Either imp or spend depending on how the Line was configured.
  • Daily Budget: This will display either the dollar amount or the number of impressions that the Line will attempt to spend each day. This daily budget will incorporate your budget multiplier to estimate daily budget.
  • Split Count: The number of optimizations that have been made to the Line.
  • Pacing: This is the % of the Line’s budget that has been spent compared to the ideal pacing based on the set budget and flight dates. Ideally a Line should pace between 90-110%. For tips to improve pacing see here: Improving Pacing.
  • Total Imps Served: The total number of impressions that the Line has served to date.
  • Spend: Total dollar amount the Line has spent to date.
  • Measured Imps: Number of impressions that are measured for viewability by the publisher from start date to ‘yesterday’.
  • Viewable Imps: Number of impressions that were registered as viewable from start date to ‘yesterday’. This means that 50% of the Creative was viewable for at least 1 second. Edit the Line Targeting parameters to include a viewability threshold to improve viewability.
  • Post Click Convs: The total number of post-click conversions driven by this Line from start date to ‘yesterday’.
  • Post View Convs: The total number of post-view conversions driven by this Line from start date to ‘yesterday’.
  • Last Opt Date: This is the date of the most recent optimization made to the Line Item.
  • Performance: This will display the performance of the Line Item in relation to the selected KPI. If you are optimizing to CTR, performance will display the lifetime CTR for the Line. If you are optimizing to CPA, performance will display the lifetime CPA in dollars.

Real Time Delivery


The Real Time Delivery chart below the Line Item Flight Metrics displays impressions for the Line Item in Real Time. This chart breaks down delivery into 15 minute increments, allowing you monitor pacing throughout the day. (NOTE: This will only be available for Creatives uploaded AFTER Jan 25, 2021)

Line Item Performance Metrics

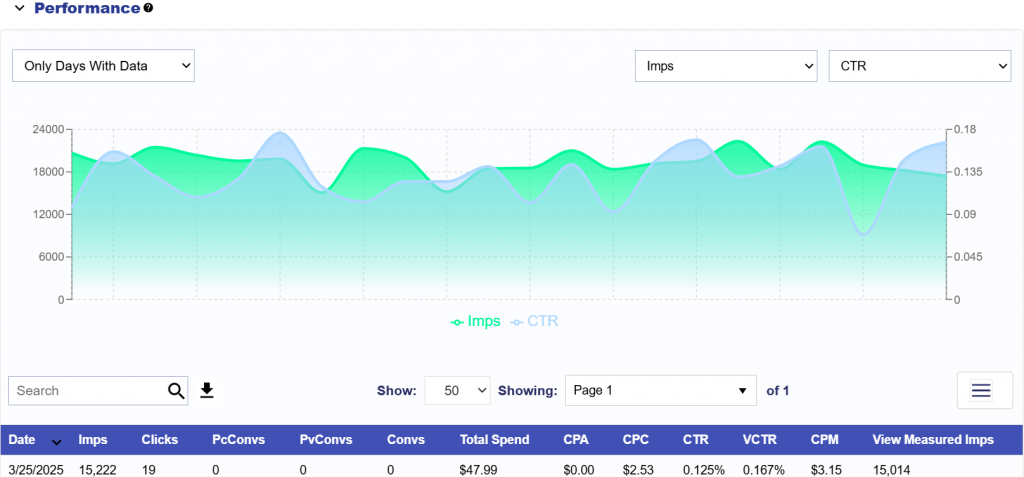
Inside a Line Item, under the ‘Performance’ dropdown, you can see detailed metrics for the Line Item broken out by date. The metrics for the current date will be updated on a 3-hour delay, except for ‘IP Conversions’ and ‘Foot Traffic Attributed Visitors’. IP Conversions are updated each day for the previous day. Foot Traffic metrics are on a 3-5 day delay.

Choose your ‘Reporting Interval’ and evaluate the following metrics at a glance:

  • Imps: Impressions served on this date.
  • Clicks: The number of clicks that occurred on the impressions served this date.
  • PcConv: The number of post-click conversions that occurred on this date. A post-click conversion indicates a user that clicked on an ad served through Pontiac and then completed a transaction within the ‘post-click’ expiration window as defined during the configuration of the conversion pixel.
  • PvConvs: The number of post-view conversions that occurred on this date. A Post-View Conversion is generated by a user that viewed an ad served through Pontiac, and later completed a transaction within the ‘post-view’ expiration window as defined during the configuration of the conversion pixel.
  • Total Spend: Total dollar amount spent on this date.
  • CPA: The ‘cost-per-acquisition’ for this date. This metric is calculated by dividing the total spend by the total number of conversions (both post-view and post-click) and indicates the cost per conversion.
  • CPC: The ‘cost-per-click’ for this date. This metric is calculated by dividing the total spend by the total number of clicks on that date.
  • CTR: ‘Click through rate’, this is the number of clicks divided by number of impressions on this date.
  • VCTR: ‘viewable click through rate’, This is calculated by dividing the number of clicks by the total number of VIEWABLE impressions for this date.
  • View Measured Imps: Number of impressions that are measured for viewability by the publisher on this date.
  • Viewed Imps: Number of impressions that were registered as viewable. This means that 50% of the Creative was viewable for at least 1 second. Edit the Line Targeting parameters to include a viewability threshold to improve viewability.
  • IP Conversions: IP Conversions registered on this date. IP Conversions will not appear for the current date. These numbers are updated once a day for the previous day’s metrics. Read more about IP Conversions here: IP Conversion Pixel
  • Foot Traffic “Attributed Vistors”: Foot Traffic visitors registered on this date at one of the Foot Traffic addresses or geo-frames entered. Foot Traffic visits will be reported in UTC, regardless of the timezone for the account. Foot Traffic metrics are on a 3-5 day delay. In this field a ‘—’ will indicate that the data has not yet been processed, while a ‘0’ will indicate that the data has been processed, but there were no visitors for that day. Read more about Foot Traffic Reporting here: Foot Traffic Attribution

Audio/Video Metrics

In the Line Item screen under the standard ‘Performance’ chart and metrics, there will be an additional section for Audio and Video Line Items with completion quartile metrics. These metrics are on a 3 hour delay.

Choose your ‘Reporting Interval’ and evaluate the following metrics at a glance:

  • Spend per Complete: Total Spend divided by the number of 100% video or audio completions. This is the cost for each completion on this date.
  • 25% Complete: The number of users that viewed or listened to at least 25% of the ad on this date.
  • 50% Complete: The number of users that viewed or listened to at least 50% of the ad on this date.
  • 75% Complete: The number of users that viewed or listened to at least 70% of the ad on this date.
  • 100% Complete: The number of users that viewed or listened to 100% of the ad, these are video or audio completions on this date.
  • Completion Rate: The percentage of viewers or listeners who watched or listened to the entire video or audio clip. Calculation: (Number of viewers or listeners who completed the video or audio clip / Total number of viewers or listeners who started the video or audio clip ) * 100
  • Skips: The number of users that skipped the ad on this date.
  • Starts: The number of users that started viewing or listening to the ad on this date.

© 2025 Pontiac Wiki Sec · All Rights Reserved · Developed by RDK

  • Contact Us
  • Privacy Policy
  • Terms & Conditions
  • Pontiac.media