Pontiac Wiki Pontiac Wiki

Standard Reporting Dashboard

Standard Reporting Dashboard

  • Reporting Dashboard Summary
  • Creatives Reporting
  • Site Domain Reporting
  • Exchange Reporting
  • Device Type Reporting
  • Segment Performance
  • Geo Region Reporting
  • Geo Country Reporting
  • Latitude/Longitude Reporting
  1. Home
  2. Origin Documentation
  3. Reporting
  4. Standard Reporting Dashboard

Reporting Dashboard Summary

The Pontiac Intelligence Reporting Dashboard allows you to evaluate a single Line Item, or all of the Line Items under an Advertiser across all important metrics for a Reporting Interval of ‘today’, ‘yesterday’, ‘7 days’ or ‘30 days’ or ‘month to date’. In the ‘Reporting’ tab select the Advertiser, Line Item and Reporting Interval, then select ‘Update Reporting’. These metrics are updated hourly with a 3 hour delay.

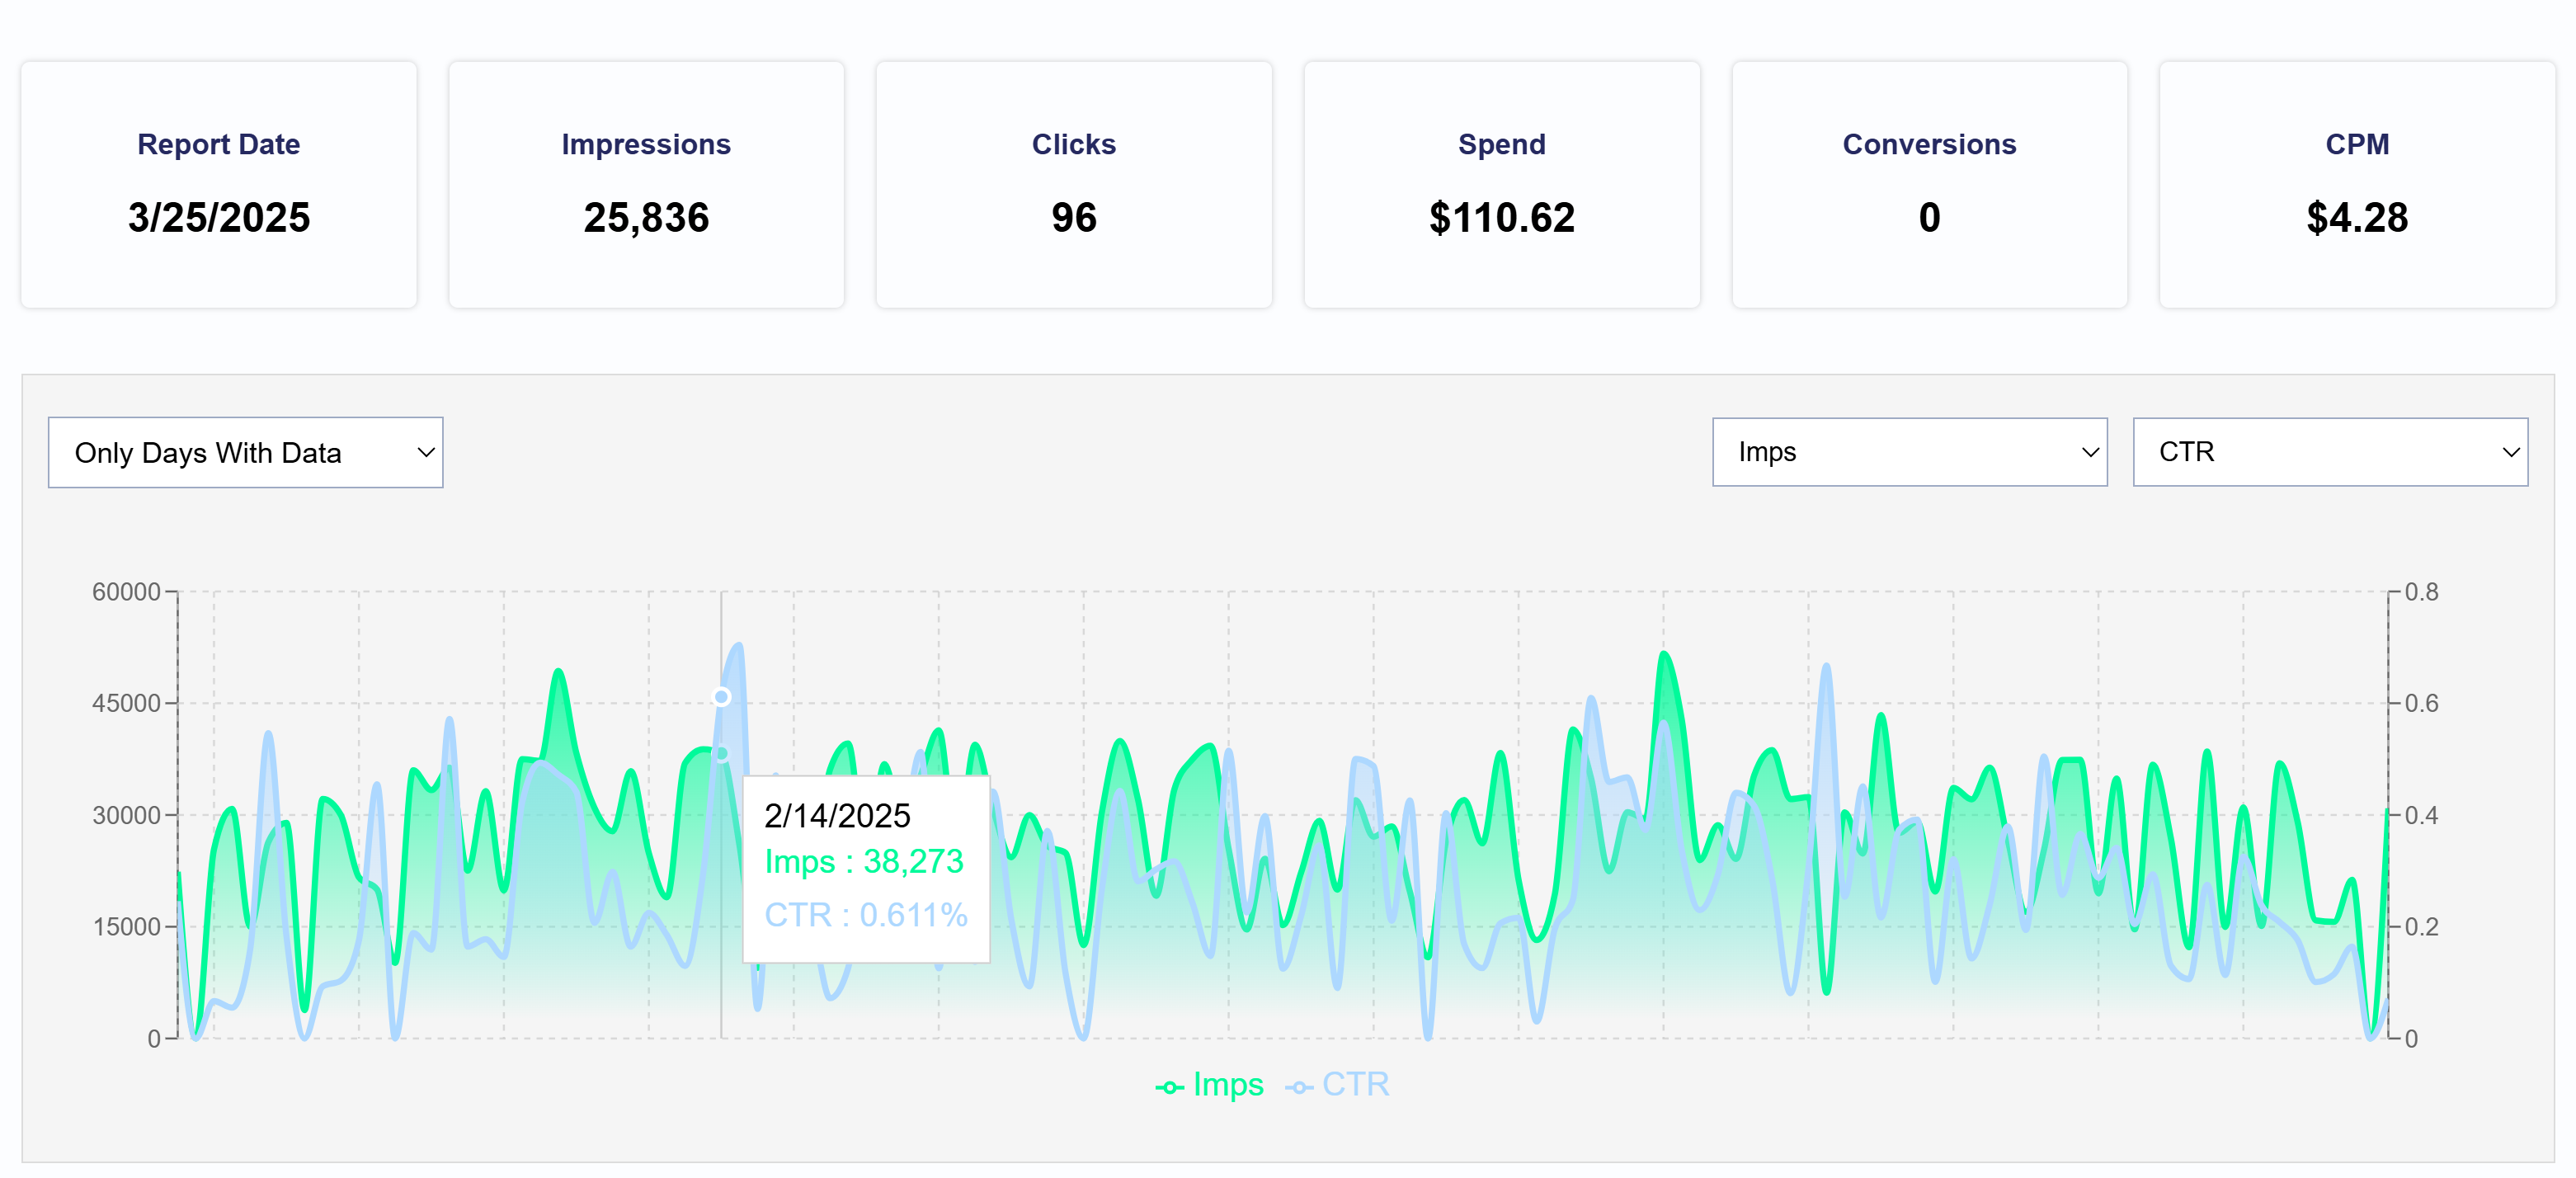
The reporting tile at the top shows the report data, impressions, clicks, spend, conversions, and CPM for the chosen reporting interval. The first graph in the summary allows you to select 2 metrics and view a breakdown for each day in the lifetime of a campaign or Advertiser. You can also filter to show only days with data or choose to show all days.

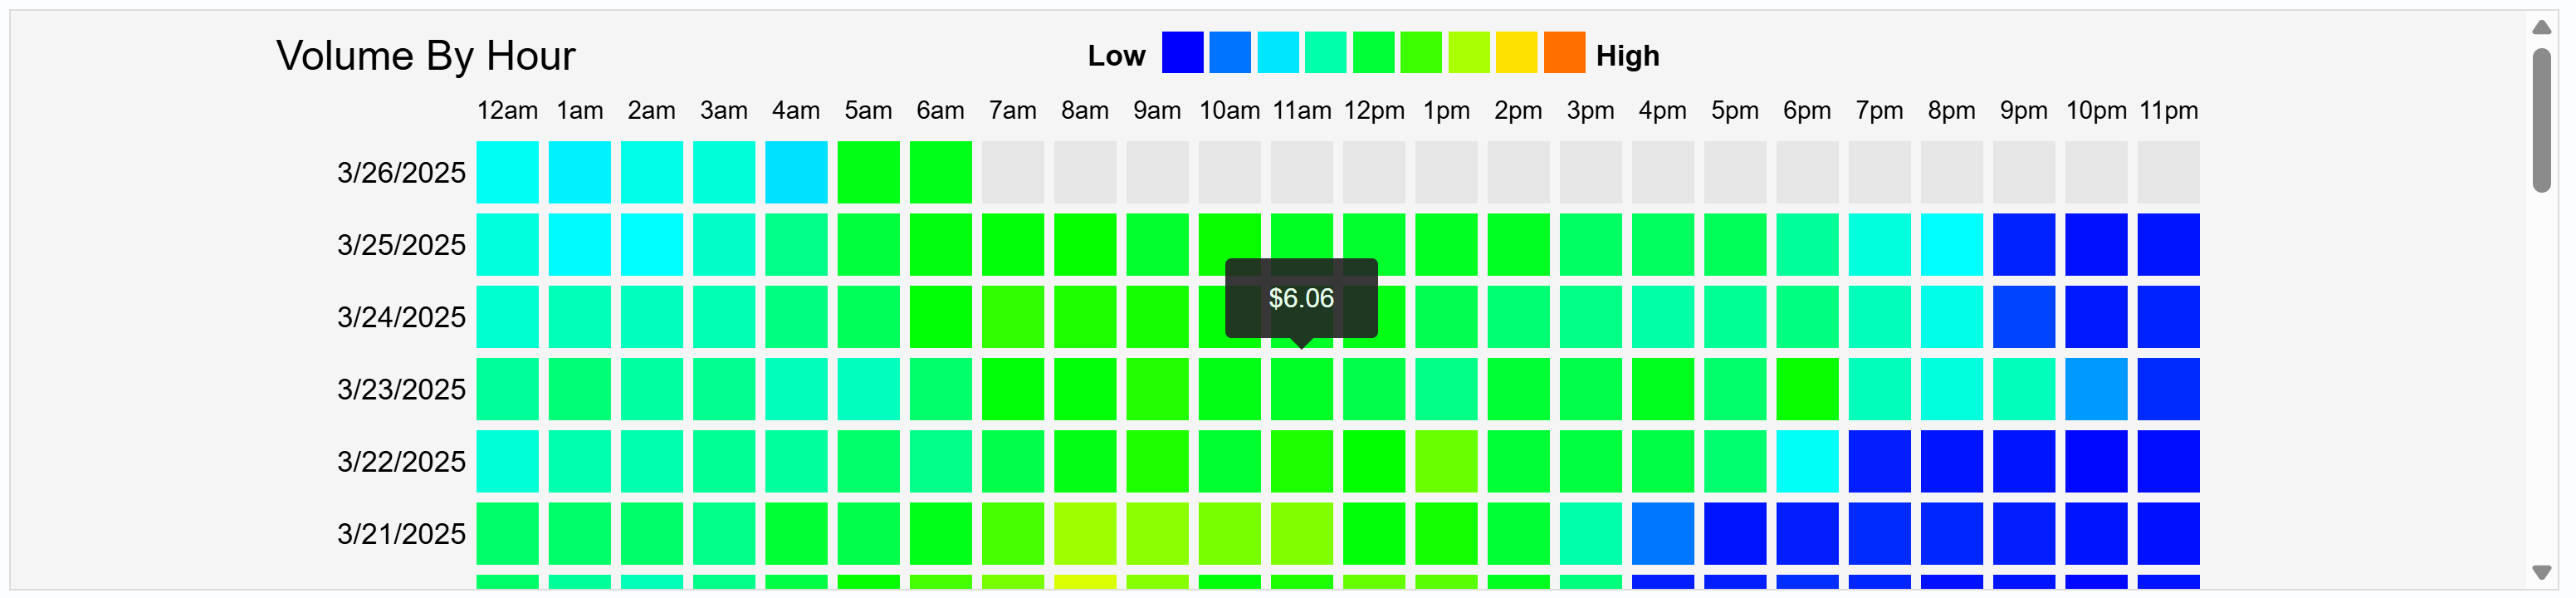
The ‘Volume By Hour’ bar displays impressions on a scale from low volume in blue to high volume in red, displaying how impression volume and spend vary throughout the day. This information displays in Coordinated Universal Time (UTC).

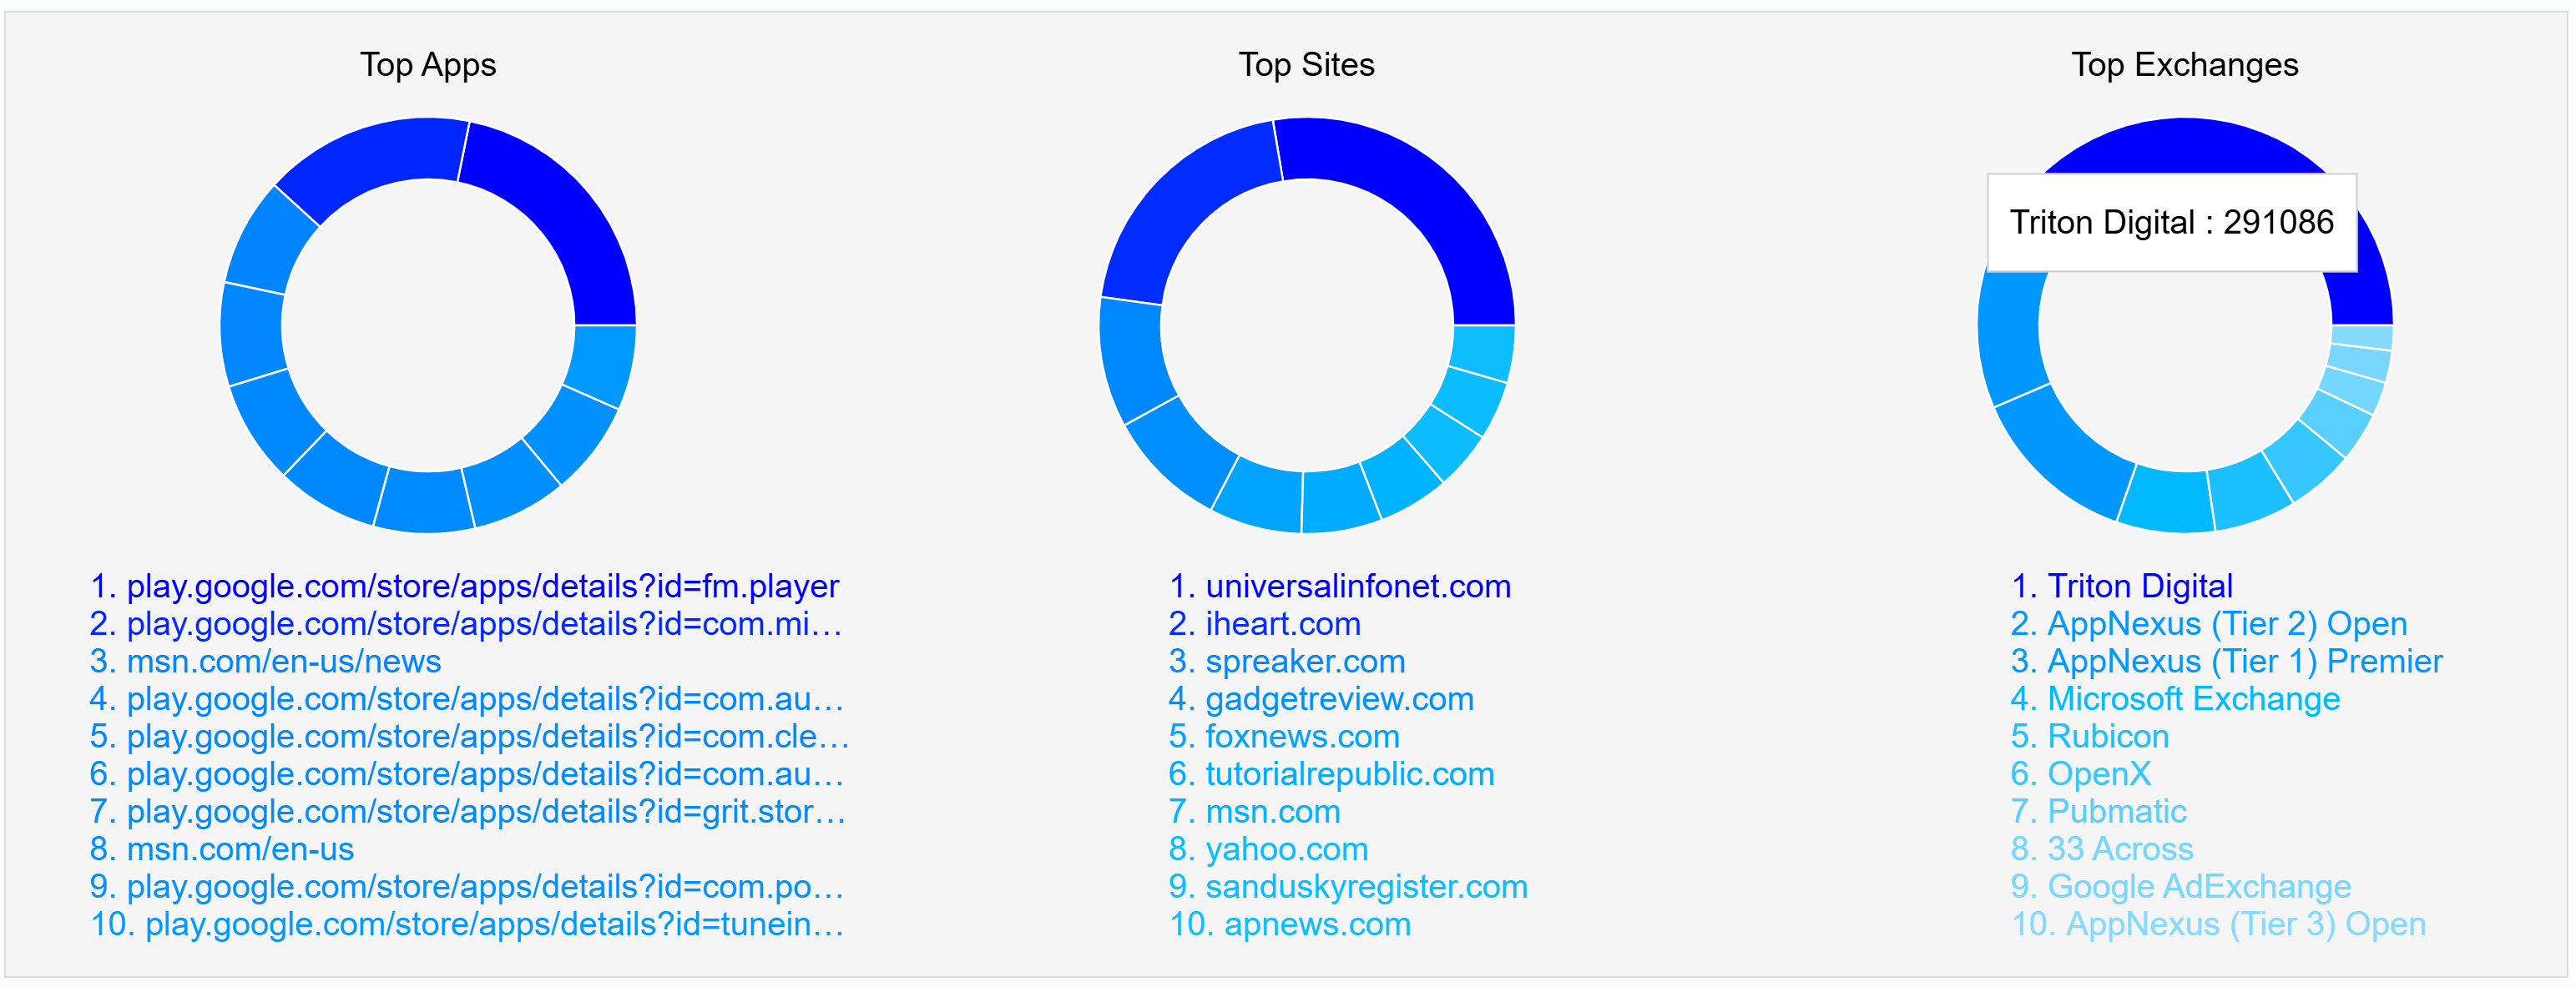
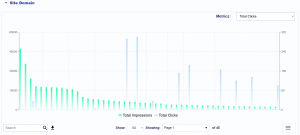
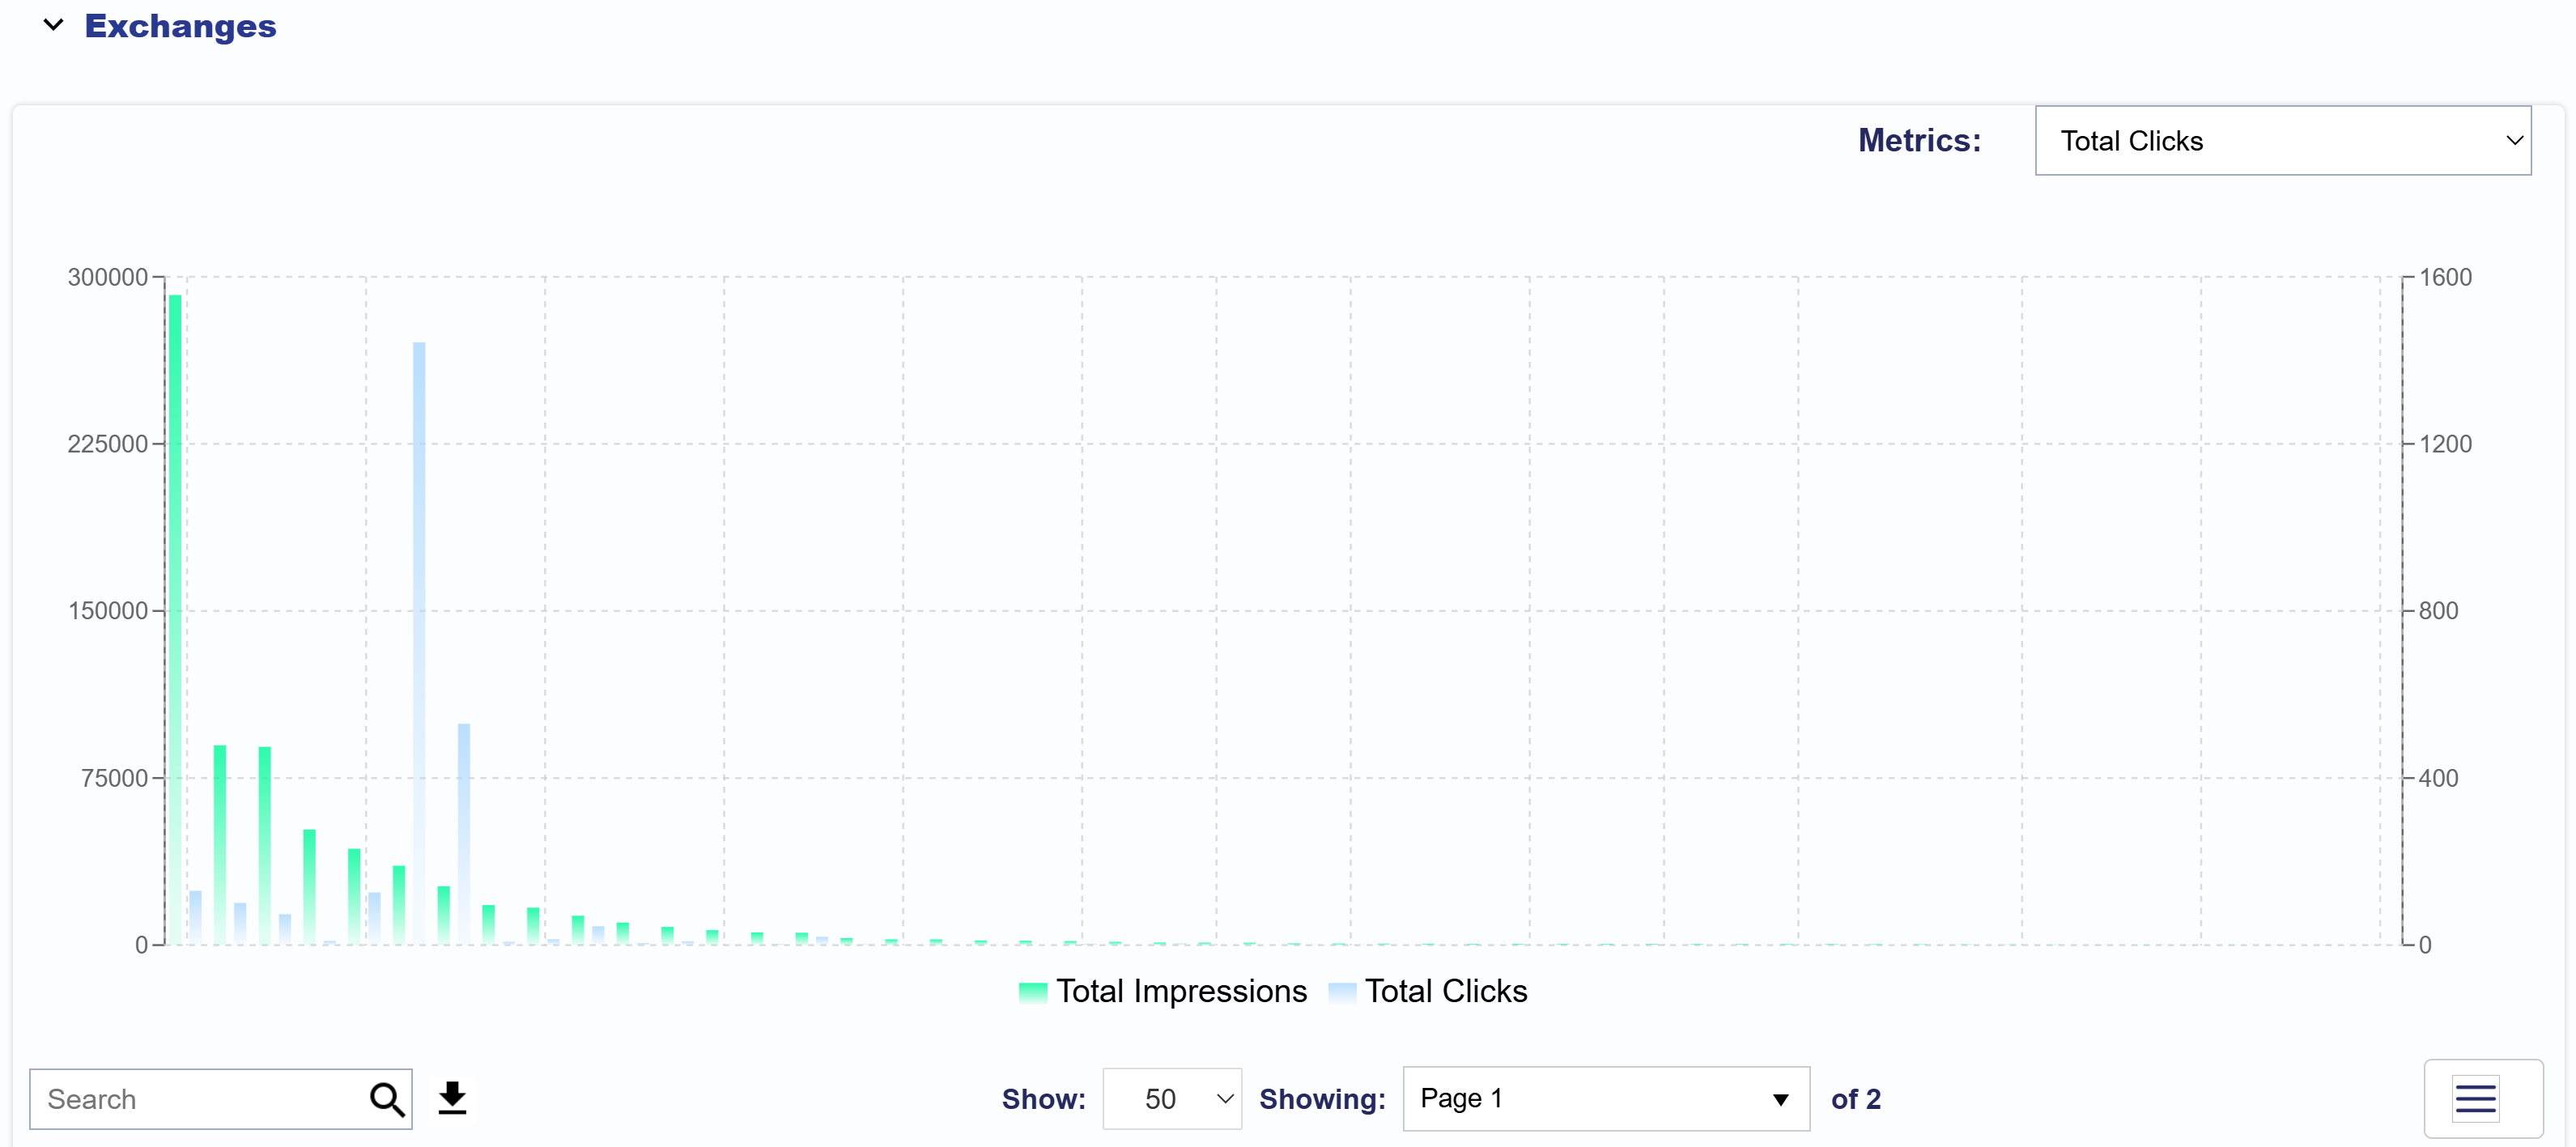
Below the volume by hour chart you can see top apps, top sites and top exchanges by volume of impressions.

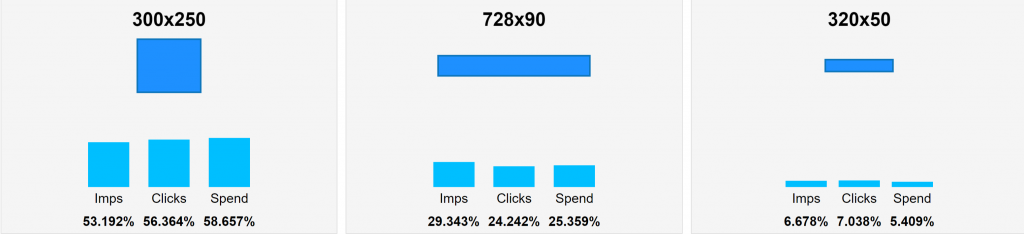
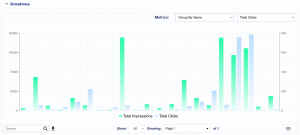
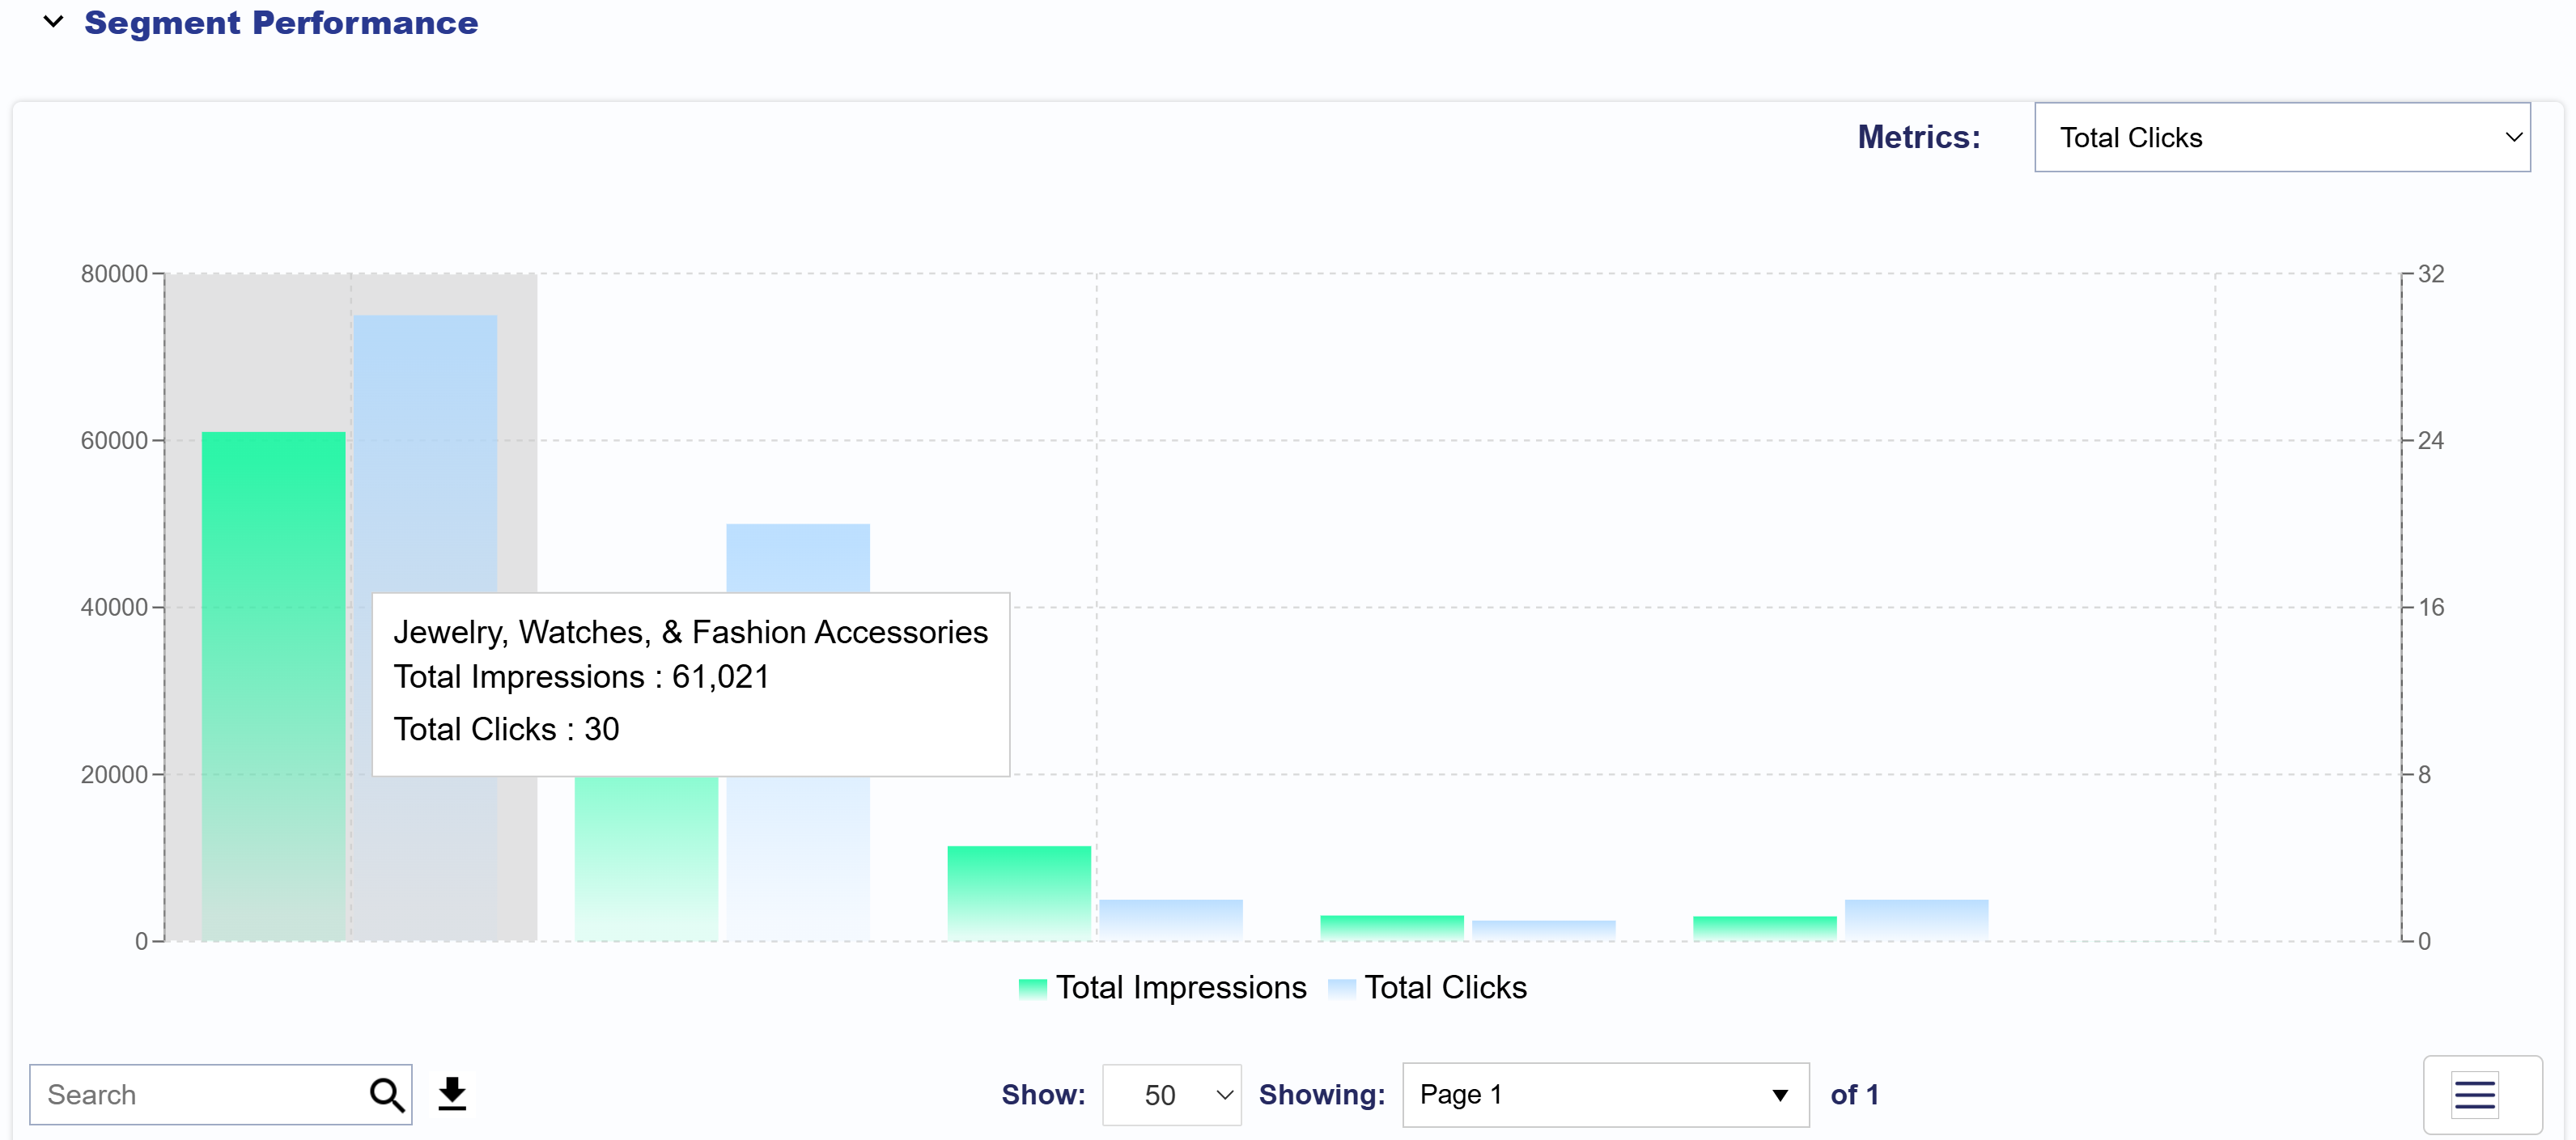
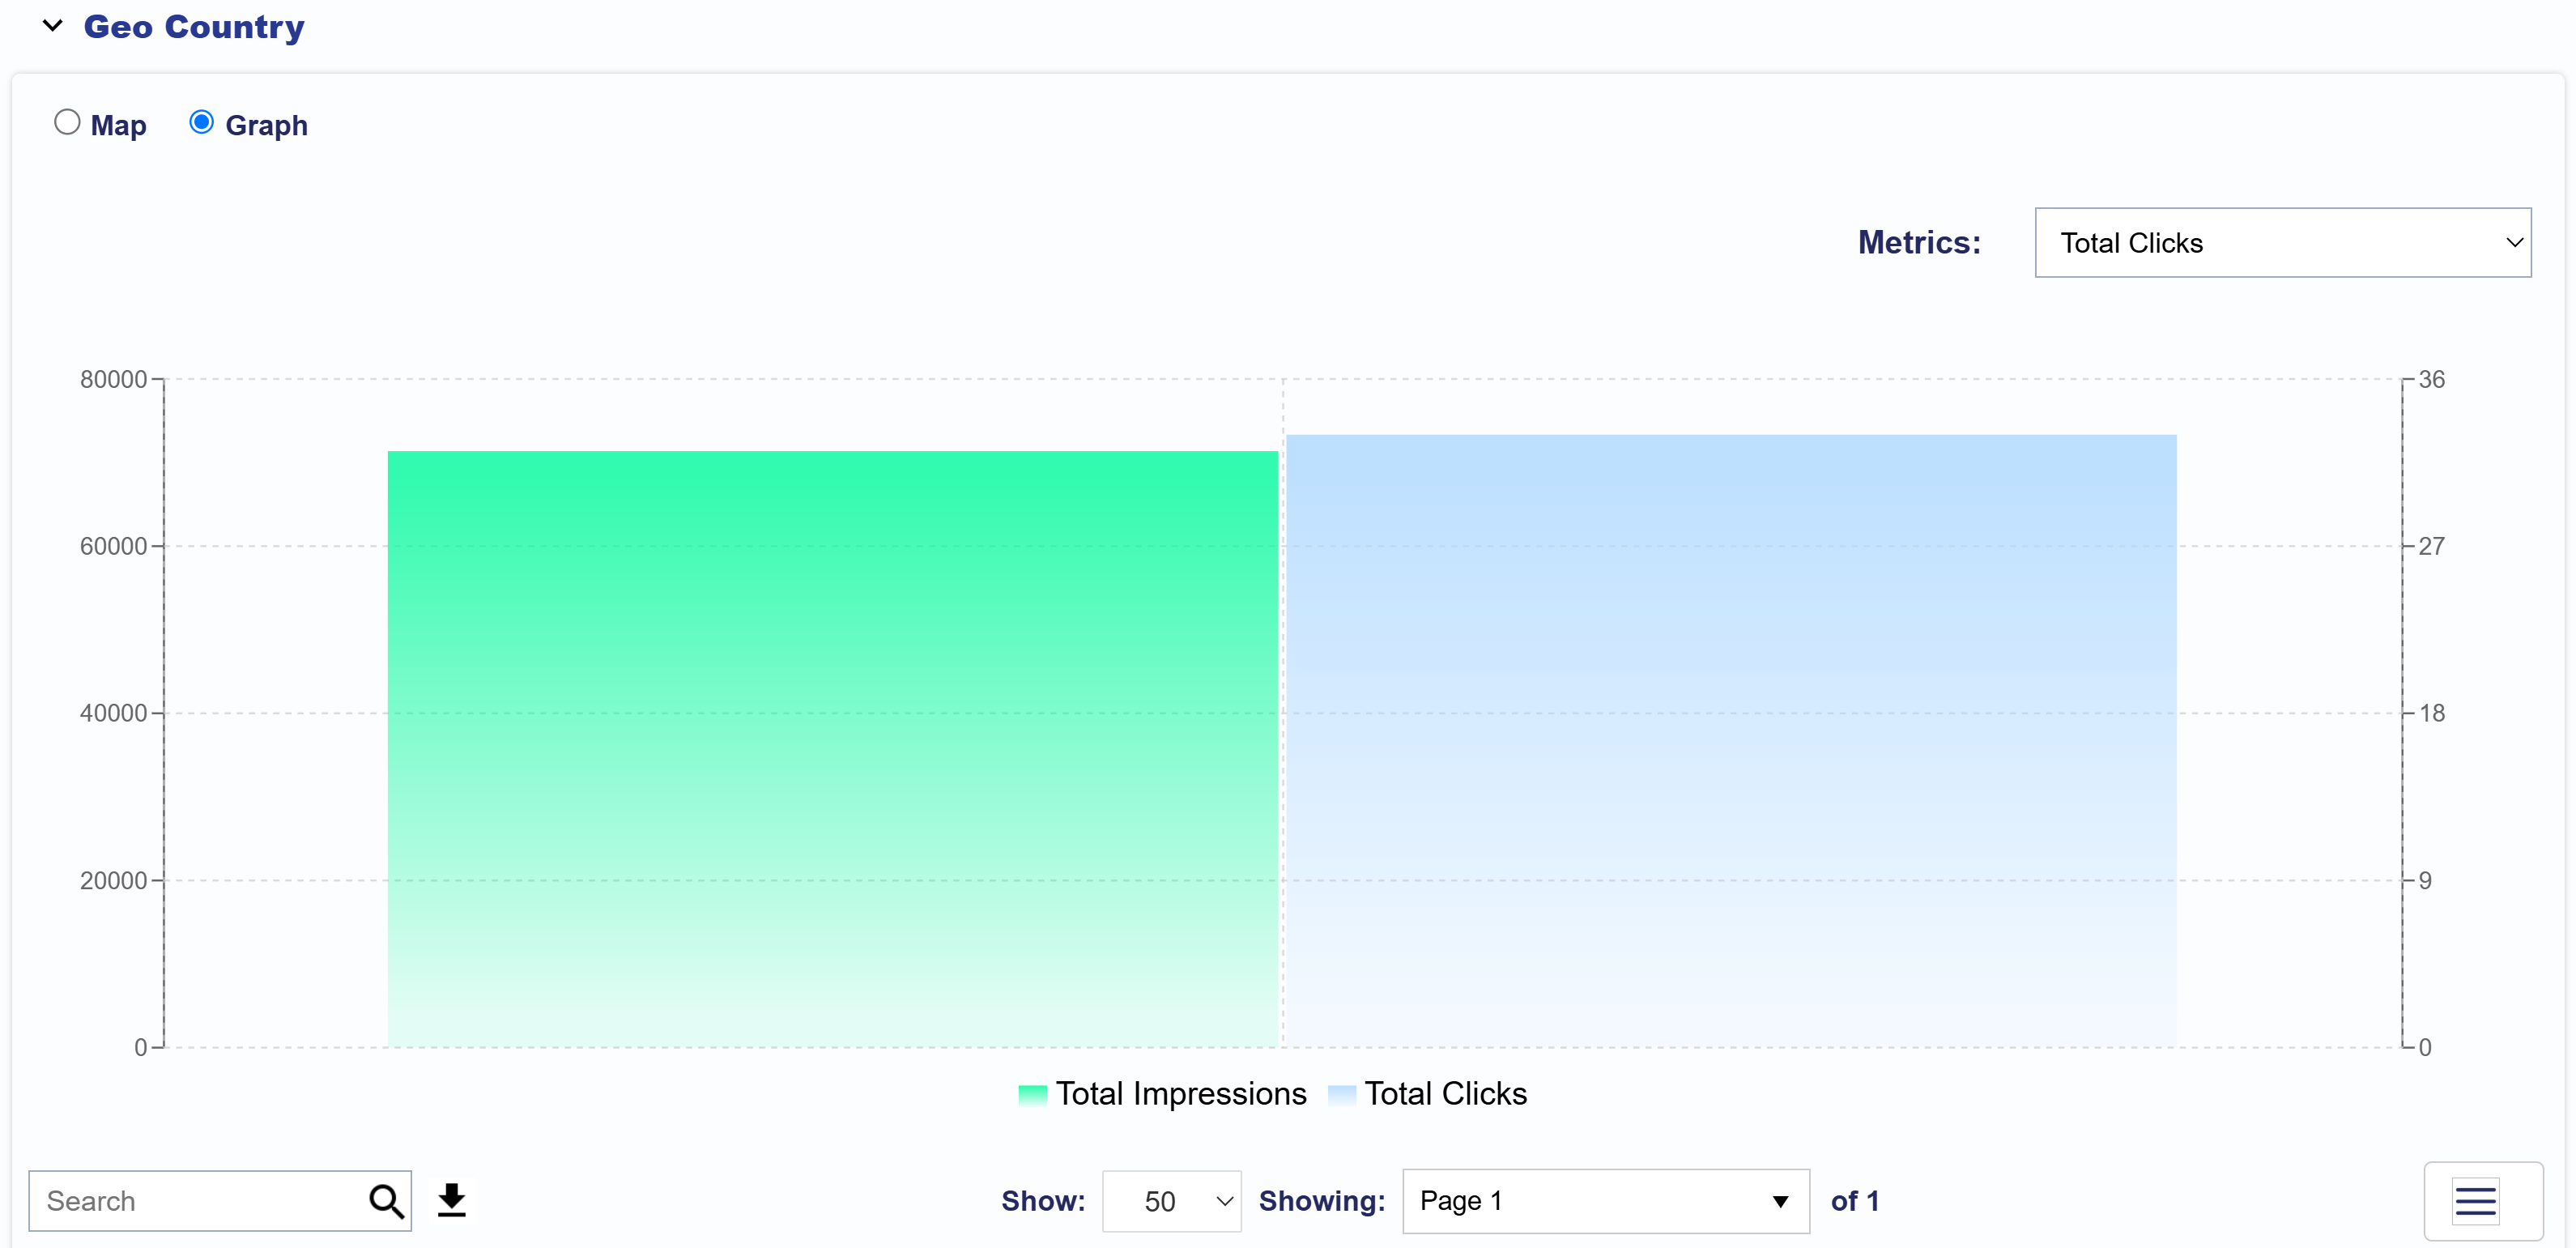
This summary also includes metrics for the top Creatives in your campaign for a quick comparison of impressions, clicks and spend.

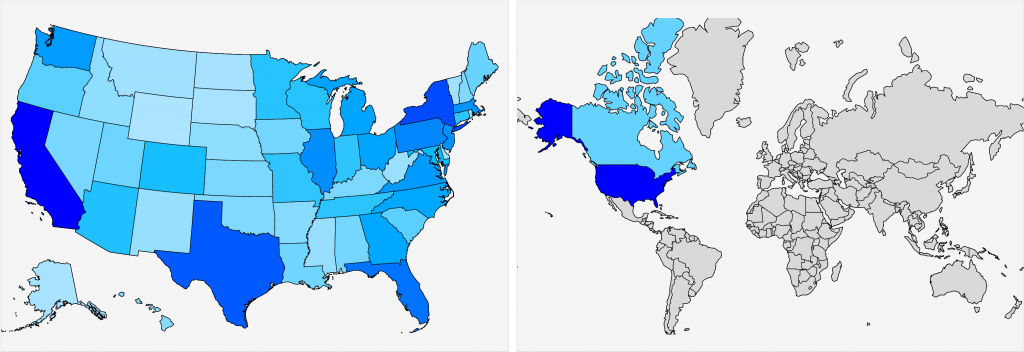
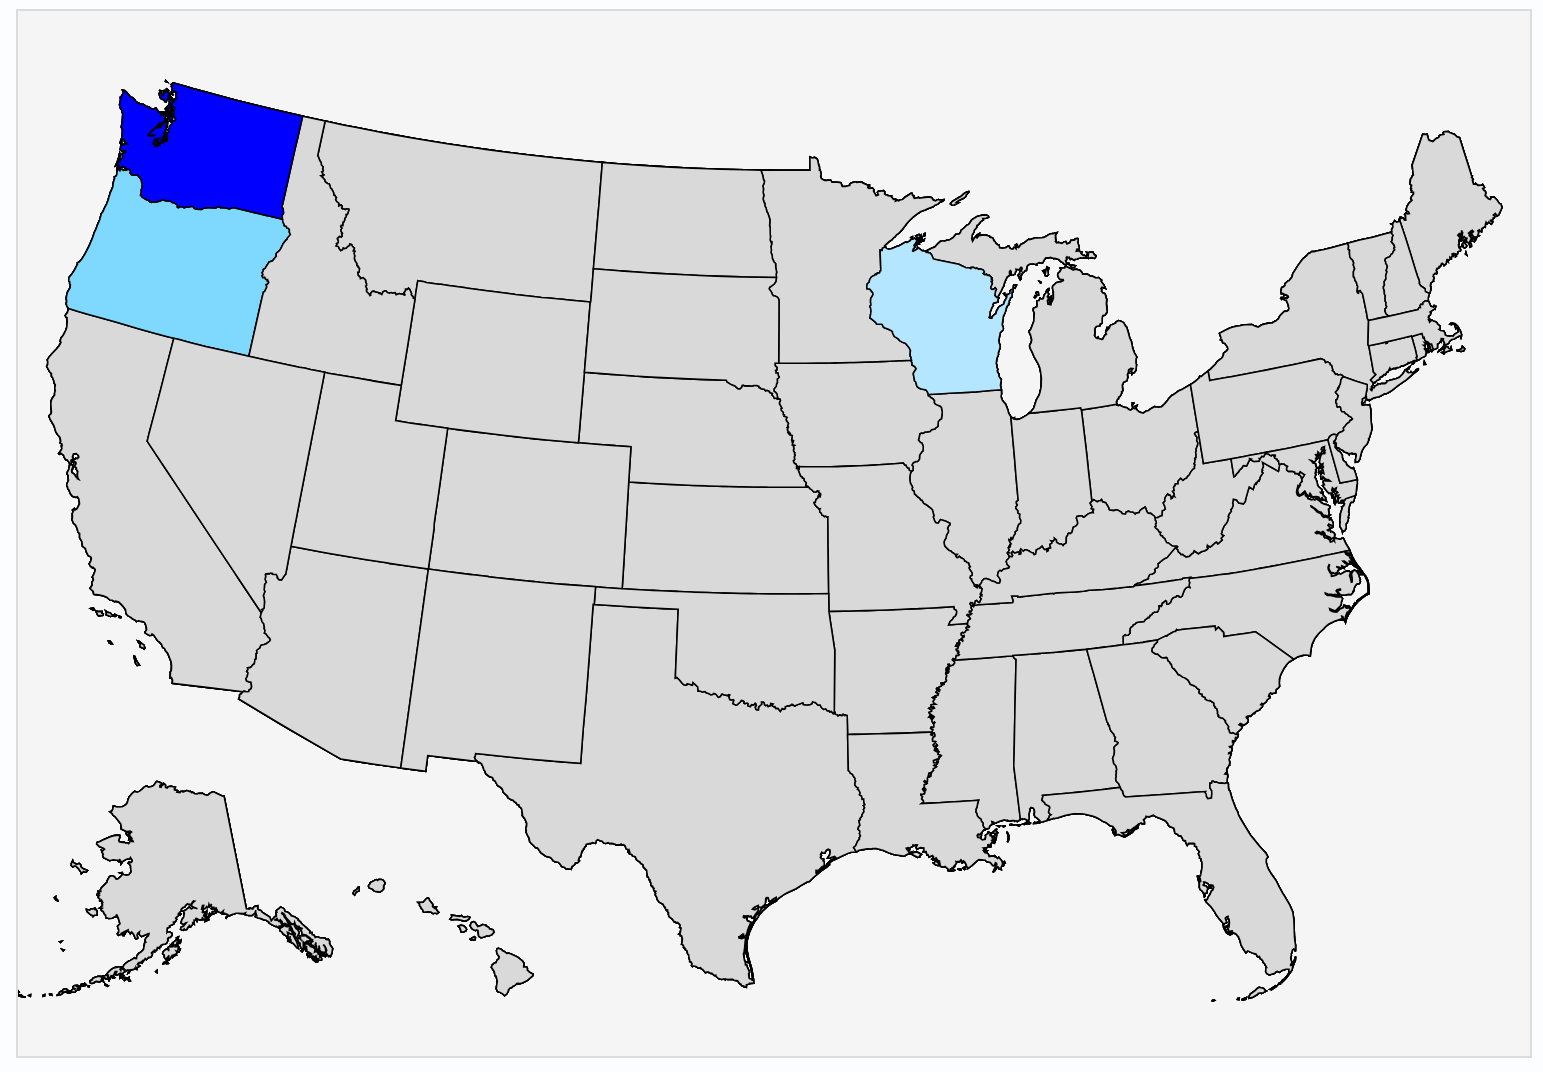
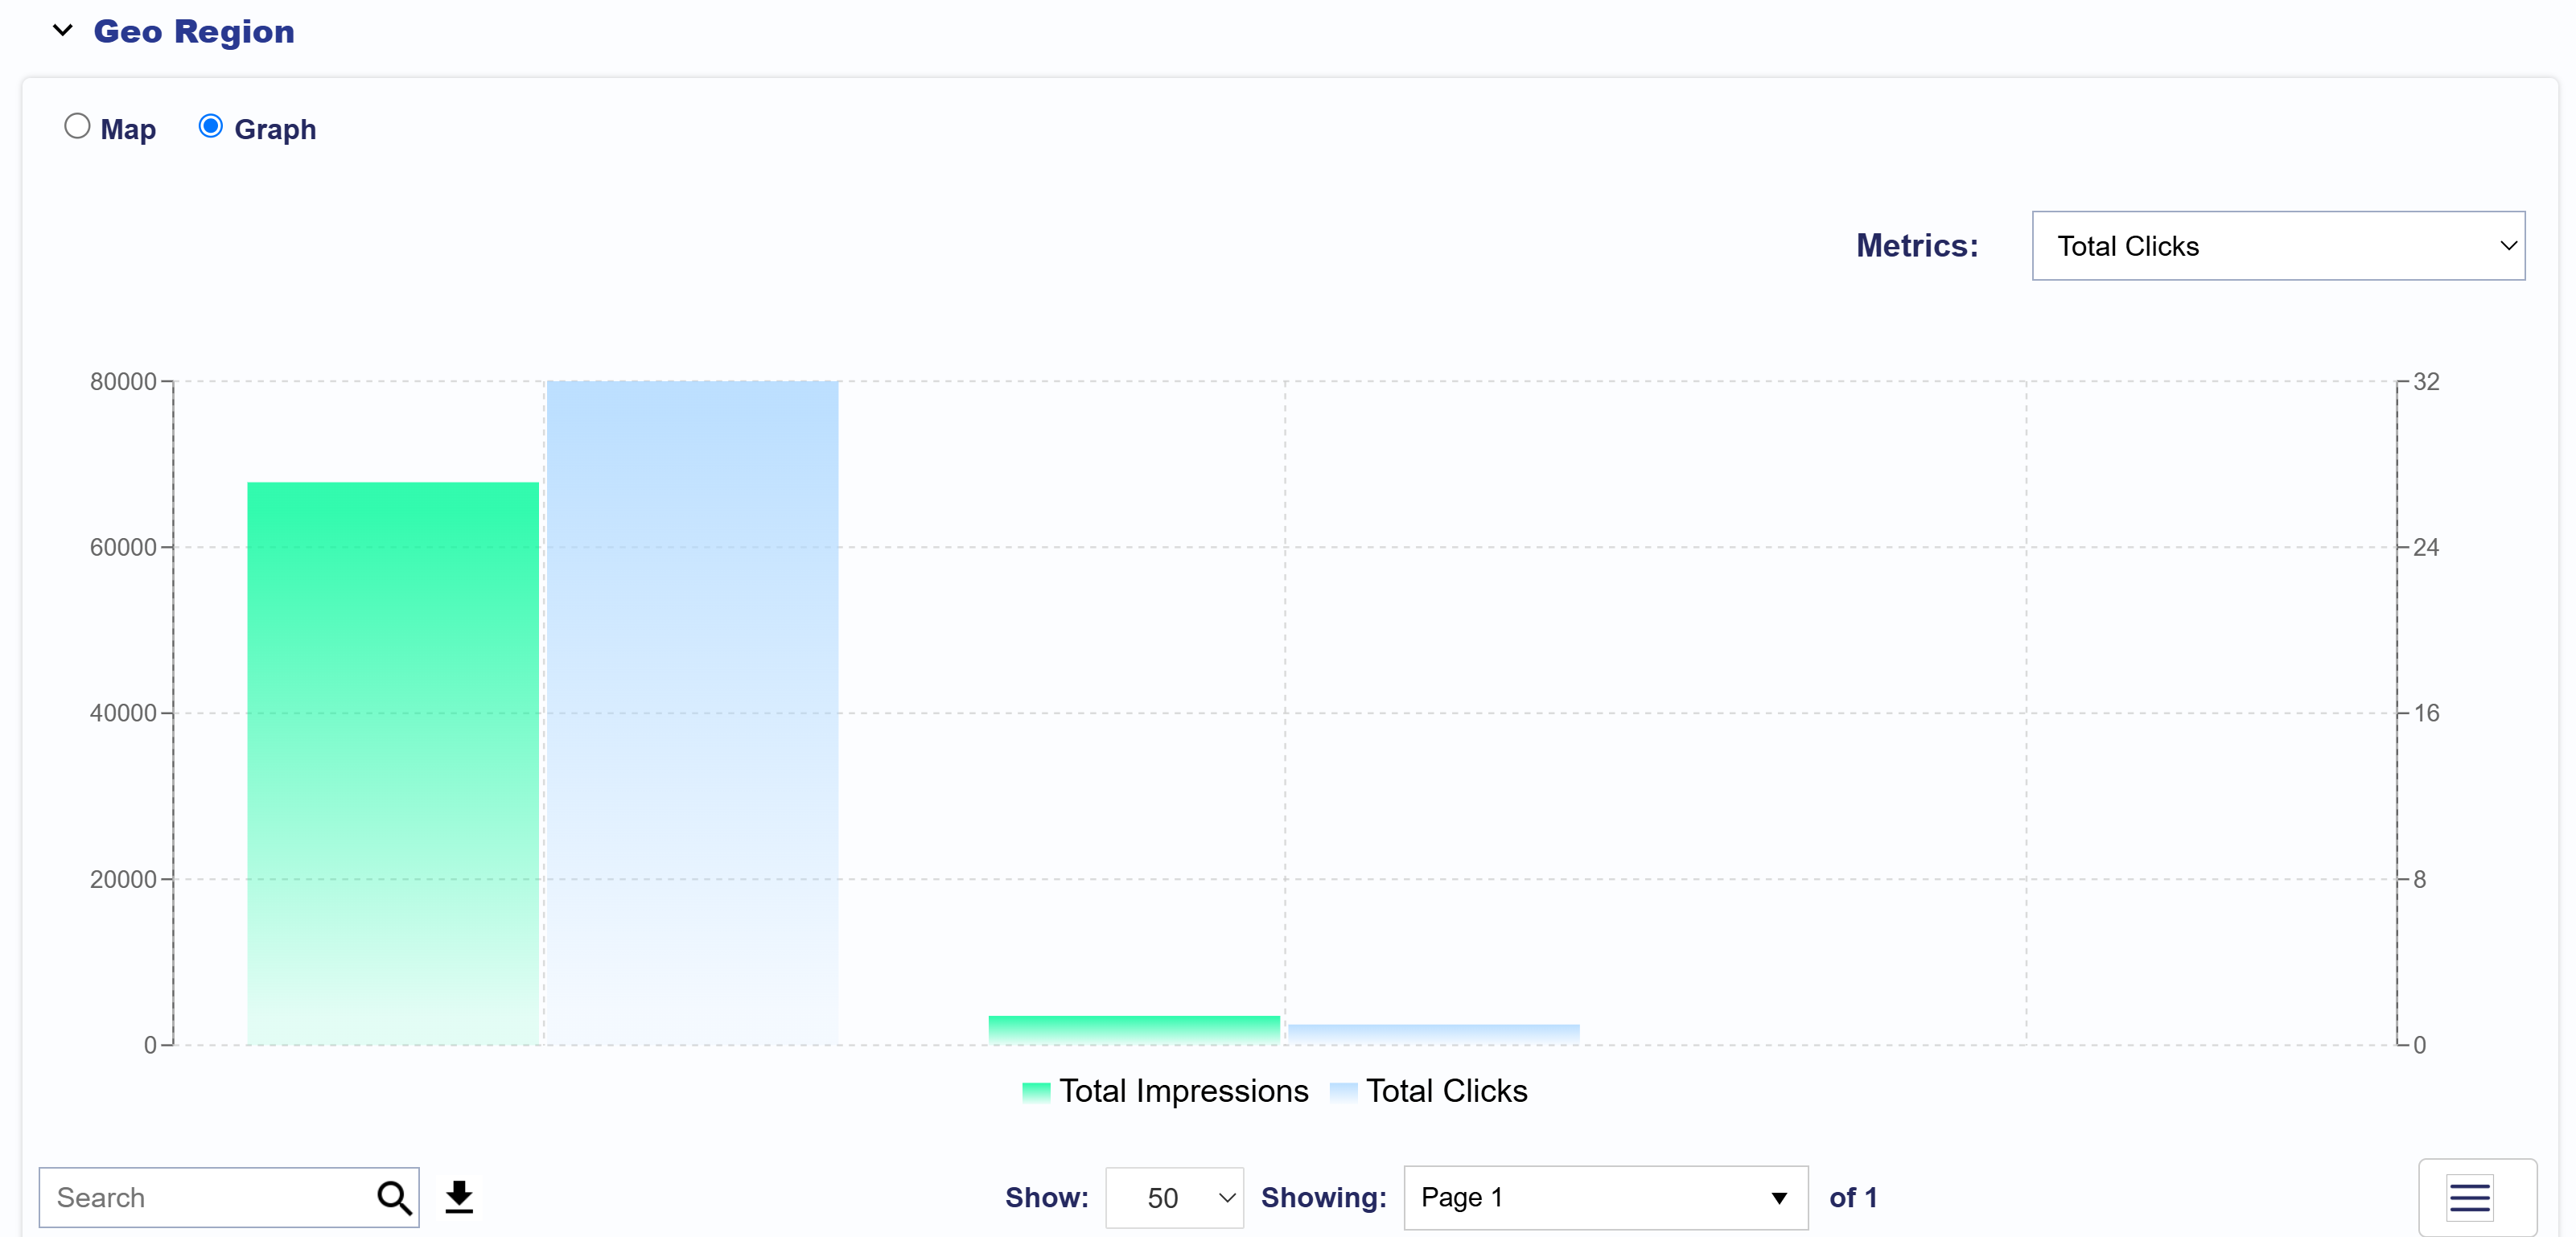
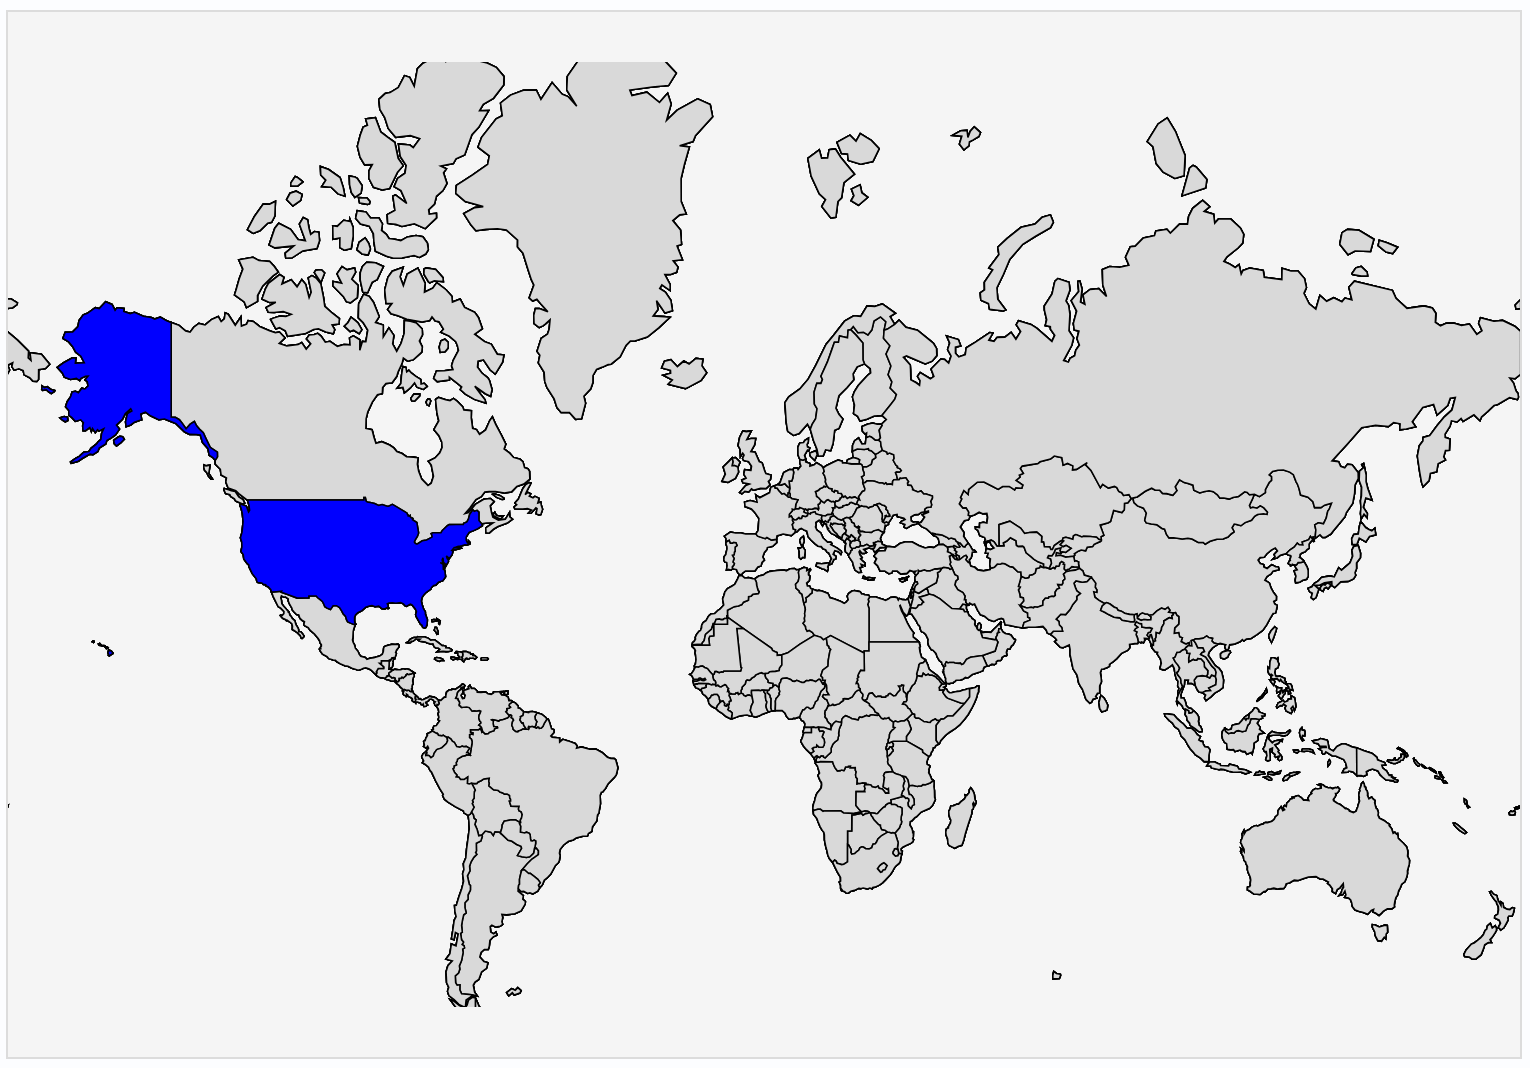
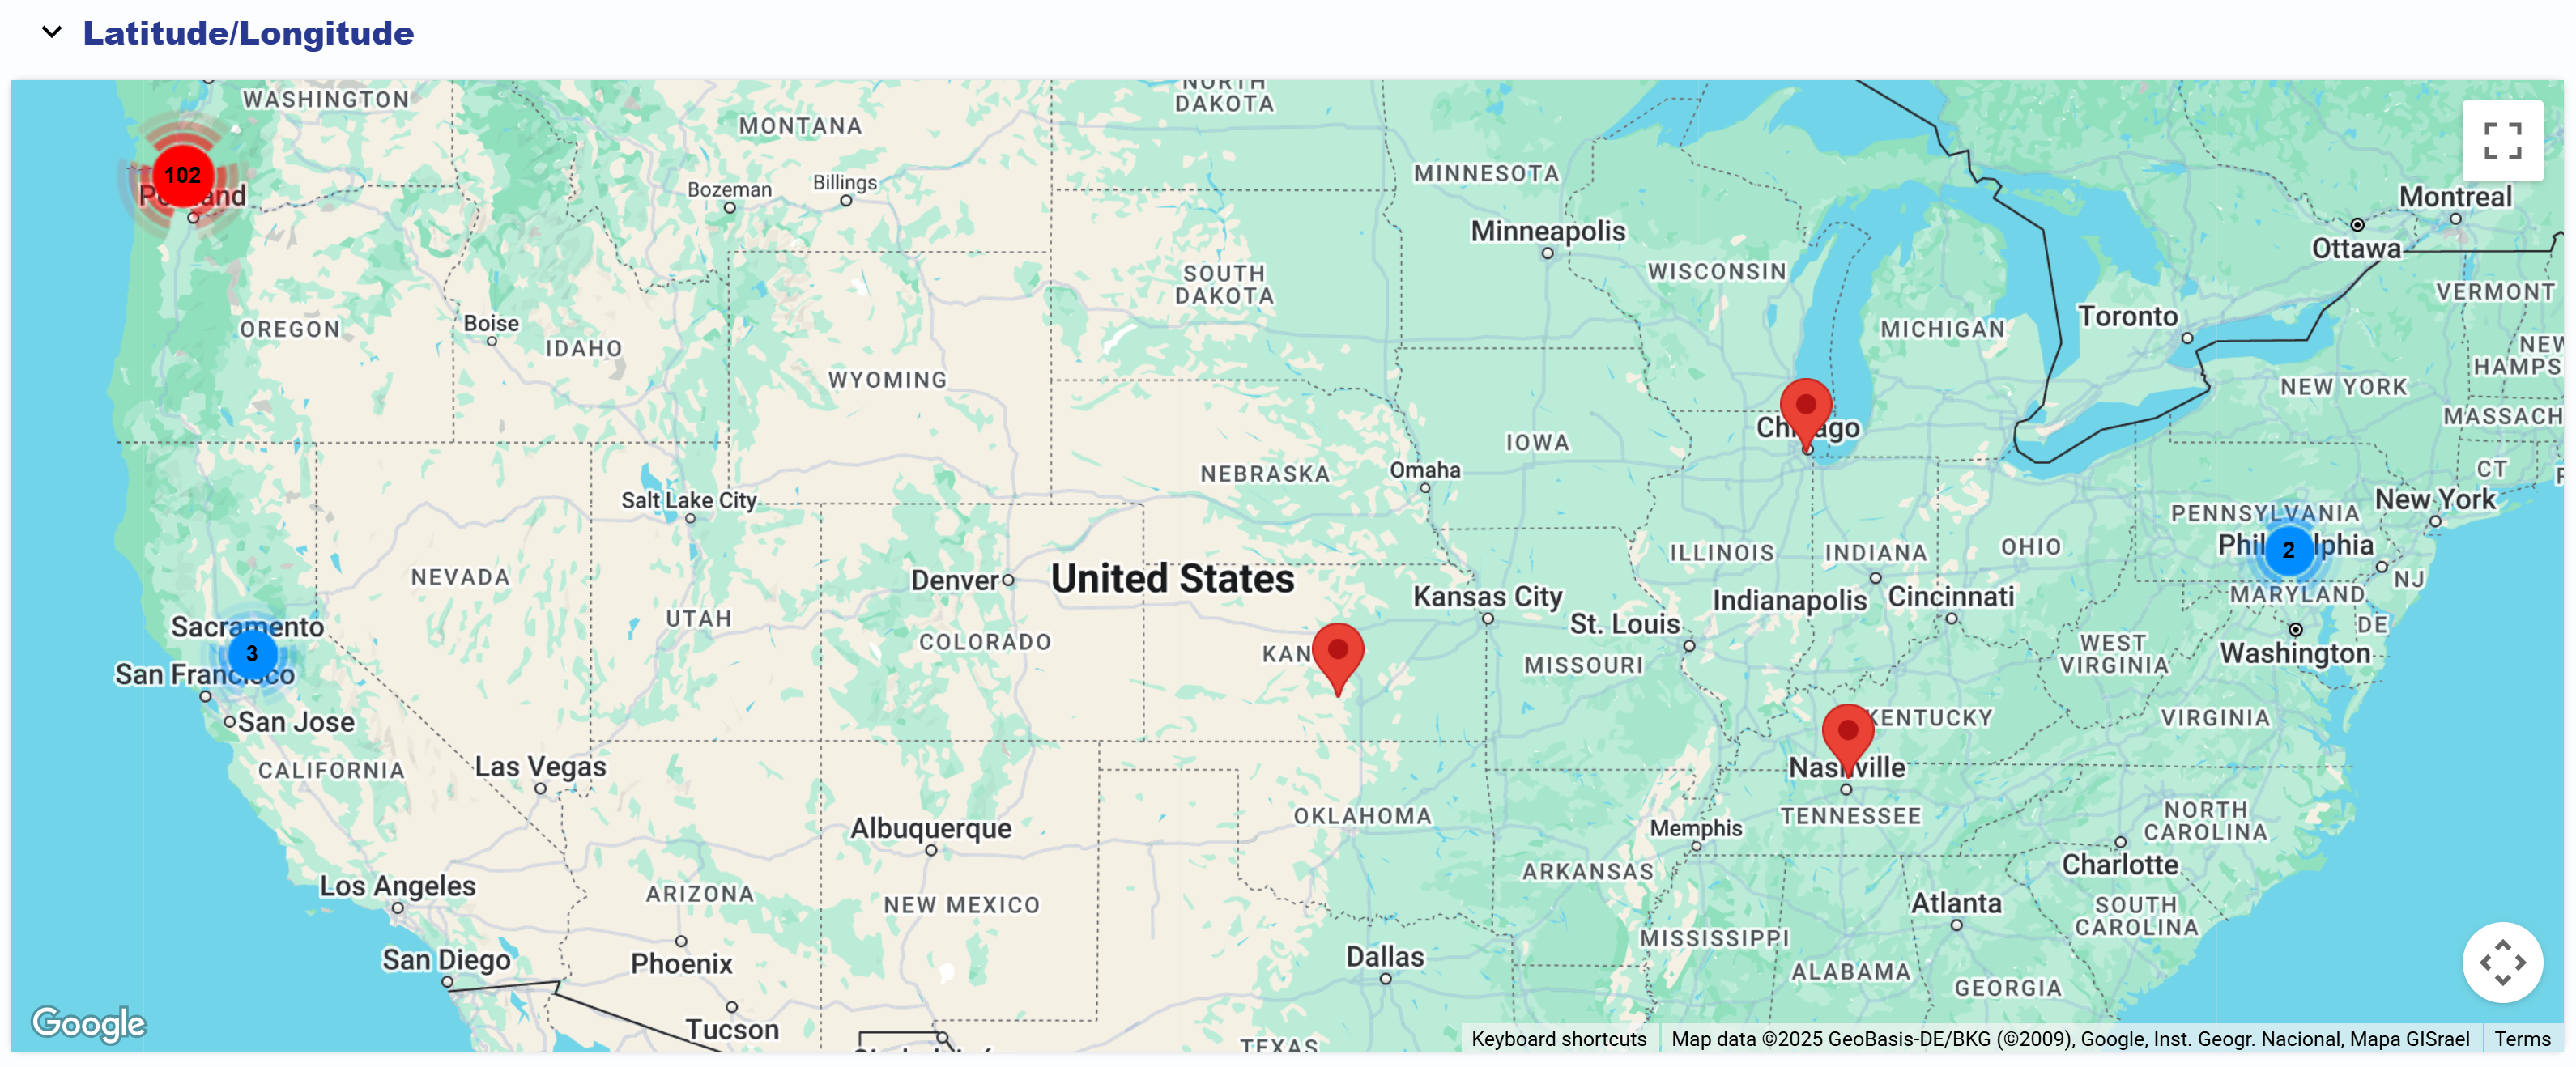
The last section of the summary is an interactive map shaded by volume of impressions. Hover over a spot on the map to see metrics for a state or country.

Creatives Reporting

This section displays a chart that visualizes the total number of impressions for each Creative, along with a second metric of your choice (Total Clicks, Total Pc Conversions, Total Pv Conversions or Total Spend). You can view metrics for each Creative by name or group them by size to easily compare performance across all of your Creatives. Below the chart, a detailed data table provides all relevant Creative metrics, which can be downloaded as a CSV file by clicking the black down arrow next to the search bar.

Site Domain Reporting

This section displays a chart that visualizes the total number of impressions for each site domain, along with a second metric of your choice (Total Clicks, Total Pc Conversions, Total Pv Conversions or Total Spend). Domain reporting can be used to determine high performing sites to create a new site list or to identify and then anti-target inventory with low performance. Below the chart, all of the data is available in a table that can be downloaded as a CSV file by clicking the black down arrow next to the search bar.

Exchange Reporting

This section will display a chart with the number of impressions bought through each Exchange, along with a second metric of your choice (Total Clicks, Total Pc Conversions, Total Pv Conversions or Total Spend). This section is valuable for making manual optimizations to your campaigns by evaluating the performance across each Exchange and removing the Exchanges with poor performance. Below the chart, all of the data is available in a table that can be downloaded as a CSV file by clicking the black down arrow next to the search bar.

Device Type Reporting

This section will display a chart with the number of impressions by Device Type, along with a second metric of your choice (Total Clicks, Total Pc Conversions, Total Pv Conversions or Total Spend). Below the chart, all of the data is available in a table that can be downloaded as a CSV file by clicking the black down arrow next to the search bar.

Segment Performance

This section will display a chart with the number of impressions by Audience segment, along with a second metric of your choice (Total Clicks, Total Pc Conversions, Total Pv Conversions or Total Spend). Below the chart, all of the data is available in a table that can be downloaded as a CSV file by clicking the black down arrow next to the search bar. This provides insight into who your campaign is serving impressions to and which segments are converting.

Geo Region Reporting

Geo Region Map

Geo Region Graph

This section can be shown as a Map or as a Graph. The map is only available for campaigns served in the United States and the Region will be by state. Metrics for regions in other countries will be shown in the table below the map. The graph will compare impressions by region along with a second metric of your choice (Total Clicks, Total Pc Conversions, Total Pv Conversions or Total Spend). Below the graph, all of the data is available in a table that can be downloaded as a CSV file by clicking the black down arrow next to the search bar.

Geo Country Reporting

Geo Country Map

Geo Country Graph

This section can be shown as a map or as a graph and will break-out impressions by Country along with a second metric of your choice (Total Clicks, Total Pc Conversions, Total Pv Conversions or Total Spend). Below the graph, all of the data is available in a table that can be downloaded as a CSV file by clicking the black down arrow next to the search bar.

Latitude/Longitude Reporting

This section will pin the exact location of each impression on a map. Click on the pin to see the exact latitude and longitude where the impression was served.

© 2025 Pontiac Wiki Sec · All Rights Reserved · Developed by RDK

  • Contact Us
  • Privacy Policy
  • Terms & Conditions
  • Pontiac.media