Pontiac Wiki Pontiac Wiki

Custom Reporting

Custom Reporting

  • Custom Reporting Overview
  • Custom Report Delivery by S3
  • Basic Custom Reports
  • Conversions Report
  • Video & Audio Events Report
  • Lifetime/Billing Report
  • Age & Gender Report
  • IP Conversion Pixel Reports
  • Reach/Frequency Report
  • Full Domain Report
  1. Home
  2. Origin Documentation
  3. Reporting
  4. Custom Reporting

Custom Reporting Overview

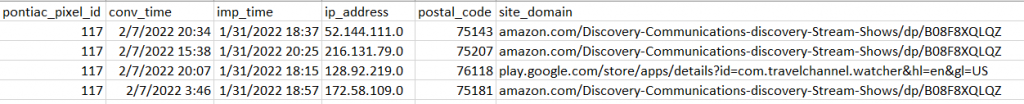
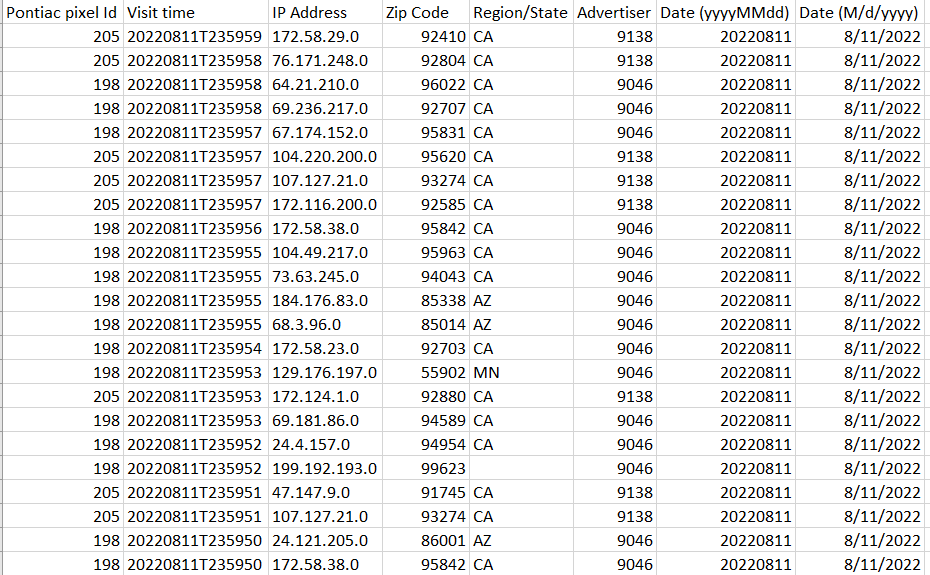
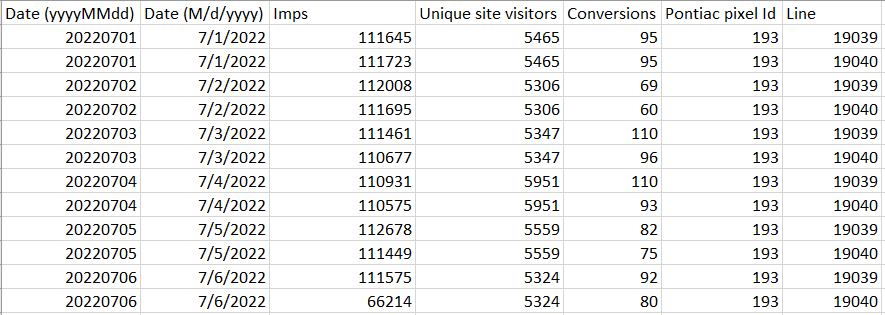
Custom reports can be scheduled for automatic delivery at daily, weekly, or monthly intervals, to either by Email, FTP or S3. Choose between a basic custom report, a conversion report, video & audio events report, lifetime/billing report, age and gender report, reach and frequency report or an IP conversion pixel report. Once you have selected the desired dimensions and metrics, click save and allow the platform a few minutes to generate the report. This report will appear under the Custom Reporting dropdown for download, or for automated reports, will be sent to your email, FTP, or S3 bucket. The Lifetime/Billing report will match the metrics in the platform for spend and is the basis for billing. Daily spend in this report will match the amount charged to the account each day. All other custom reports are compiled using incremental data and may show slight variances in total spend.

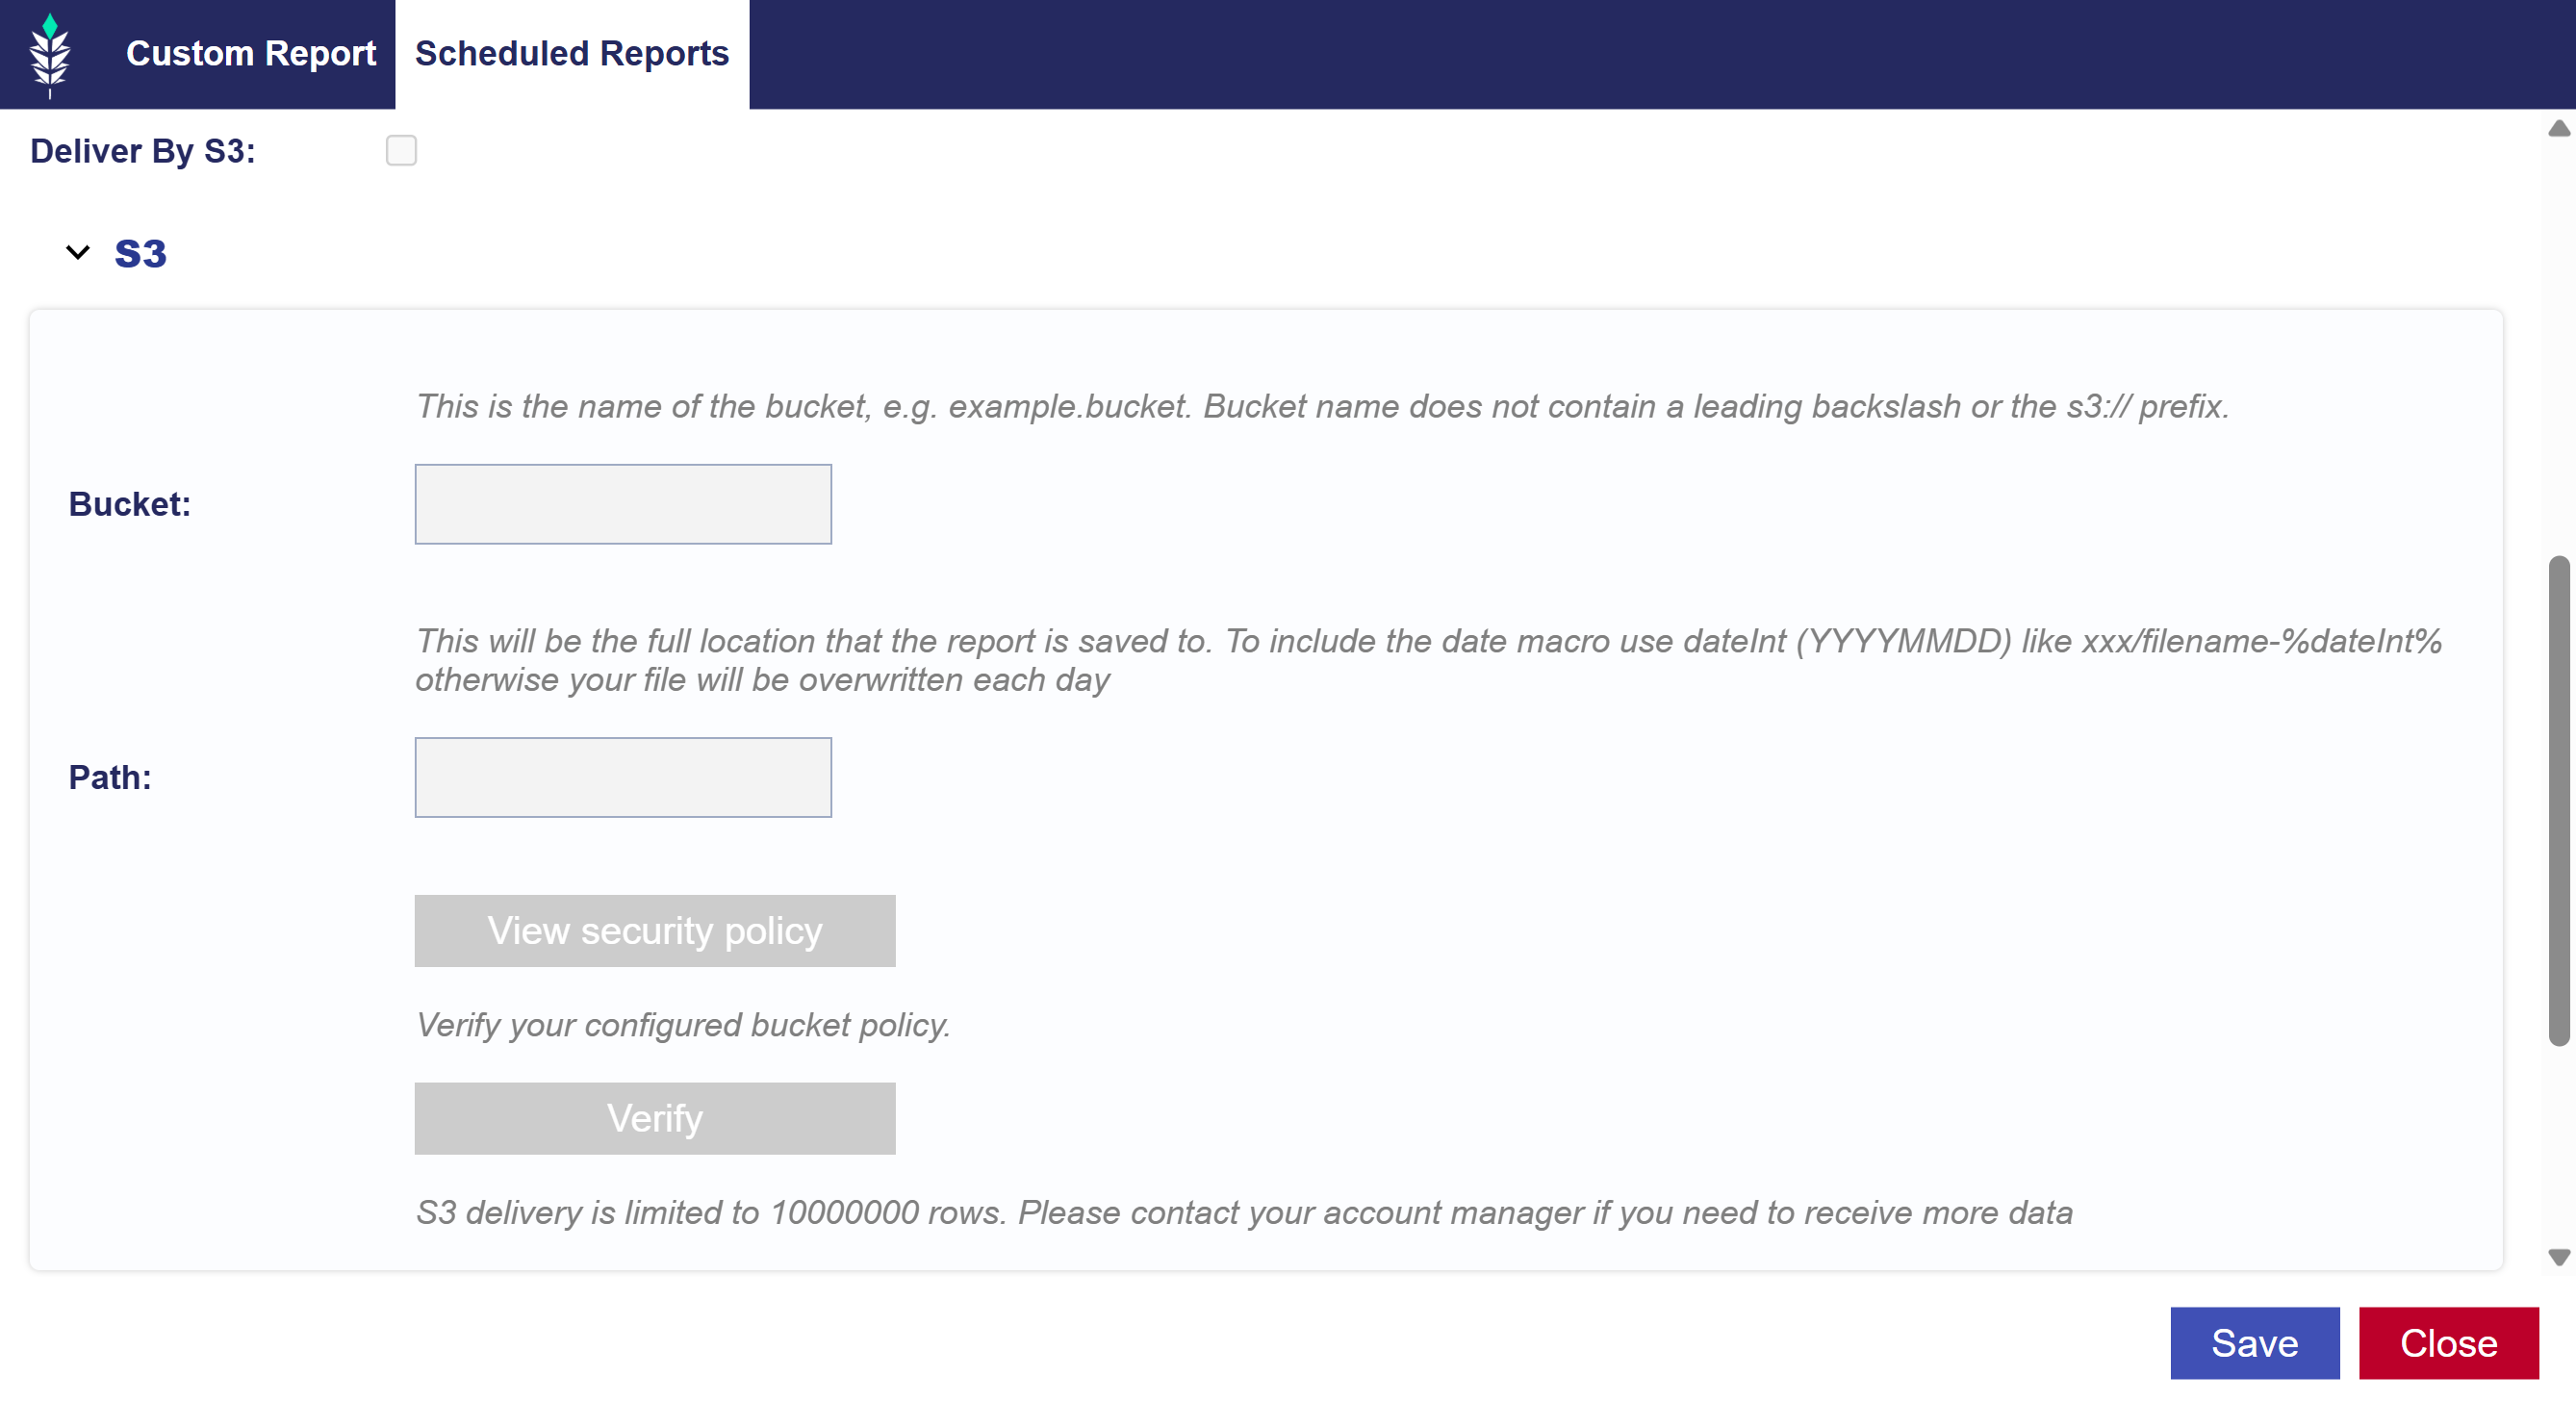
These reports allow you to customize all the dimensions and metrics you wish to evaluate, but are limited to 500,000 rows for the downloadable excel file. Automated custom reports delivered via email, FTP, S3 or Google Cloud storage are limited to 10,000,000 rows. If your report exceeds the maximum number of returnable records, there will be a yellow caution symbol next to the name of the report with an error stating that the data is incomplete. The report will still run and will return the first 500,000 rows, but the data will not be complete for the selected dates & parameters. If you need to receive additional data, you can reach out through the Help Center, separate the report into multiple reports, or limit the dimensions selected to decrease the number of rows.

Custom Reports will remain downloadable in the platform for 30 days. Expired reports must be ‘Rerun’ at a later date, however and it is possible that certain data points will no longer be available. 

Custom Report Delivery by S3

Setting up Pontiac Scheduled reports delivery in AWS S3 requires:

  1. Creating a bucket in AWS S3
  2. Setting up the report in Pontiac

These are the steps to create a sample report:

Creating a bucket in AWS S3 to receive Pontiac scheduled reports:

    1. In AWS S3 click Create Bucket
    1. Chose a bucket name that is available and the desired AWS Region.
    2. Change Object Ownership to ACLs enabled.
    3. Uncheck Block all public access field and check “I acknowledge that the current settings might result in this bucket and the objects within becoming public”.
    4. Click Create bucket.
    5. Navigate to the newly created bucket and click Create folder with the output path that we chose in Pontiac (“output-path”). Confirm to create the folder.

    Setting up the report in Pontiac

    1. Go to Reporting tab and then click New Custom Report.
    2. Check the box for Schedule Automated Report and fill out the desired details in the Custom Report tab like Advertiser ID, start and end date and select the desired metrics and dimensions.
    3. Go to Scheduled Reports tab and check Deliver by S3 box.
    4. In the expandable section fill out the Bucket field with the AWS S3 Bucket name. Example: S3-test-bucket.
    5. Fill out the Path field with a desired output path location and file name (To include the date macro use dateInt (YYYYMMDD) like xxx/filename-%dateInt% otherwise your file will be overwritten each day). Example: output-path/Pontiac-reports.csv or output-path/Pontiac-reports-%dateInt%.csv
    6. Click View security policy and copy the full text area.
    7. Go to Amazon AWS S3 and modify permissions for the bucket we chose earlier. In the Permissions tab click Edit and paste the policy text from earlier and Save.
    8. Back in Pontiac reports screen click Verify and wait for a successful confirmation message.

    Basic Custom Reports

    The Basic Custom Report allows you to choose from any of the following Dimensions and Metrics to create a detailed customized report that meets your needs.
    Dimensions:

    • Date
    • Advertiser
    • Line
    • Creative ID
    • Creative Size
    • Region/Date
    • DMA
    • Zip Code
    • Exchange
    • Browser
    • Operating System
    • Site Domain
    • App
    • Device Type 
    • Device MAke
    • Device Model 
    • Carrier
    • Deal ID
    • App ID
    • App Name

    Metrics:

    • Impressions 
    • Clicks
    • Post-Click Conversions
    • Post-View Conversions
    • Spend
    • View Measured Impressions
    • View Confirmed Impressions

    If Region/State is selected for countries outside of the United States, the report will return a numerical code that corresponds to the Region/State. Use this Region Mapping doc to map the numerical code to the Region/State where the impression was served: Region Mapping

    Conversions Report

    A conversion report is great for Advertisers looking to track conversions and attributed revenue. If the query string macros for ‘Order Id’ and ‘Revenue’ were added at the time the conversion pixel was generated, this report can be used to view this information.
    Dimensions:

    • Date
    • Pixel
    • Order Id (client populated)
    • Line

    Metrics:

    • Post-Click Revenue
    • Post-View Revenue
    • Post-Click Conversions
    • Post-View Conversions

    Video & Audio Events Report

    For campaigns running video ads, the video events report provides detailed metrics for percent completion. Choose from the Dimensions and Metrics listed below to customize your report.

    Dimensions:

    • Date
    • Line Item ID
    • Creative ID
    • Player Size
    • Advertiser
    • Exchange
    • Site Domain
    • App
    • Timestamp
    • Deal ID
    • Video Context
    • Supply Type

    Metrics:

    • Video Started
    • Had Error
    • Hit 25 Percent
    • Hit 50 Percent
    • Hit 75 Percent
    • Completed 
    • Spend

    Lifetime/Billing Report

    The lifetime report will display the dimensions and metrics of your choosing for the lifetime of an Advertiser and Line Item. This report is the basis for Pontiac Billing and will match the amount charged to the account each day as ‘daily spend’. 
    Dimensions:

    • Date
    • Advertiser
    • Advertiser Name
    • Line
    • Line Name
    • Creative Id (Creative reporting is only available going back to 12/11/2019)
    • Creative Name (Creative reporting is only available going back to 12/11/2019)
    • Hour of day (Hourly reporting is only available going back to 6/18/2020)

    Metrics:

    • Impressions 
    • Clicks
    • Post-Click Conversions
    • Post-View Conversions
    • Spend
    • View Measured Impressions
    • View Confirmed Impressions

    Age & Gender Report

    The Age and Gender Custom Report will provide a demographic breakdown across age and gender as a percentage of impressions served.
    Dimensions:

    • Age
    • Gender

    Metrics:

    • Percentage

    IP Conversion Pixel Reports

    This report can be used to pull detailed metrics from the IP Conversion Pixel, including the dates when the conversions took place and the dates when the impressions were served to those users. There are three types of reports that can be pulled from IP Conversion Pixel data, the ‘Path to Conversion’ report, the ‘Conversion Only’ report and the ‘Conversion Rate’ report.

    Path to Conversion Report

    The ‘Path to Conversion’ report provides data on the IP conversions registered as well as on the impressions served through Pontiac campaigns to those users that converted. This report can be utilized to see the entire pathway to conversion from each impression the user viewed to the action they completed on your website.

    The column ‘imp_time’ will indicate when the impression was served through Pontiac to a user that visited or converted on the site where the pixel is placed. The total number of ‘imp_times’ indicates the number of impressions that were served to users that then converted, this will correspond to the ‘Attributed Imps’ field in the IP Conversion Pixel metrics under the Advertiser.

    The ‘conv_time’ column will indicate the time the action or conversion took place on the site. The total number of unique ‘conv_times’ is the total number of unique conversions or visits that were driven by your campaign. This will correspond to the ‘Total Convs’ field in the IP Conversion Pixel metrics under the Advertiser.

    IP conversion pixels have a standard lookback of 30 days in the metrics that are displayed under the Advertiser. This means that the user must complete the desired action within 30 days of seeing the ad for it to count as a conversion. If you would like to pull reporting with a custom lookback window, this can be done in this report. Select from ‘5’, ‘7’, ’15’ or ’30’ from the ‘Lookback window’ dropdown .

    Report Dimensions:

    • Pontiac pixel Id
    • Conversion time
    • Imp Time
    • IP Address
    • Zip Code
    • Site Domain
    • Exchange
    • Region/State
    • Auction id
    • User id
    • Advertiser
    • Line
    • Device Type
    • Date
    • Creative Id
    • Order ID*
    • Order Value*

    *(work with your web developer to dynamically pass these values on IP pixel)

    Page Visits Report

    The ‘Page visits’ report will only provide data on ALL page visits or loads for this pixel. ‘Visit Time’ indicates the time of the page visit. This is not a Conversion event attributed to your campaign, it is total page visits independent of media served.

    Report Dimensions:

    • Pontiac pixel Id
    • Page visit – A page visit registered by the IP pixel. This is independent of media served and is not attributed to Pontiac campaigns.
    • IP Address
    • Zip Code
    • Region/State
    • Advertiser
    • Date (yyyyMMdd)
    • Date (M/d/yyyy)

    Conversion Rate Report

    Analyze conversion rate day over day to track the effectiveness of your ads with the ‘Conversion Rate Report’. To calculate conversion rate for each day, divide ‘Conversions’ by ‘Imps’.

    Report Dimensions:

    • Date
    • Imps
    • Unique site visitors
    • Conversions
    • Pixel Id
    • Line Id

    Reach/Frequency Report

    The Reach/Frequency report is designed to provide data on the number of unique users that were reached by a campaign. Select the Advertiser, Line Item/s, and date range, then run the report to view the following metrics:

    • Unique User IDs
    • Unique Device IDs
    • Unique IP Addresses
    • Impressions served

    Full Domain Report

    For Web campaigns running Banner, Ad server tag banner or HTML5 creatives, the full domain custom report can be used for insight into the full URL pathway where ads were served. This report provides full transparency on the exact article of your ad placements including the following metrics & dimensions:

    Dimensions:

    • Date
    • Timestamp
    • Site Domain
    • Full Domain
    • Line
    • Region/State
    • Country
    • DMA
    • Zip Code

    Metrics:

    • Impressions
    • Clicks
    • Conversions
    • Post-Click Conversions
    • Post-View Conversions (View-Thru)
    • Spend

    Note: full URL may not be reported for all impressions

    © 2025 Pontiac Wiki Sec · All Rights Reserved · Developed by RDK

    • Contact Us
    • Privacy Policy
    • Terms & Conditions
    • Pontiac.media