Inventory Availability Tool
The Inventory Availability Tool is a forecasting tool designed to provide Advertisers with data and information regarding the inventory that can be purchased through the Pontiac DSP. Using historical data and delivery trends as well as the Pontiac forecasting formula, Inventory Availability reports provide insights for planning successful media buying strategies. These reports can be utilized to check the feasibility of a combination of targeting parameters, inform bid strategy, build performance benchmarks, and estimate available scale. Inventory report data is limited to the United States at this time.
To create an Inventory Availability Report, log in to the Pontiac platform and use the switch in the top right corner to enter the ‘ART’ section of the platform. If you do not see the ‘ART’ button, reach out to the Pontiac Support Team through the Help Center. Once you are in the ‘ART’ section, open the ‘Inventory Availability’ tab. Click the ‘New Report’ button. Give the report a name and select the end date of the report. The start date will automatically populate for 180 days before the end date selected.
Then select ‘Edit Targeting’ and select one or more targeting parameters for which you would like to create a forecast report from the following:
- Exchanges: Select from the list of available exchanges
- Domains: Enter up to 100 either domains or application domains
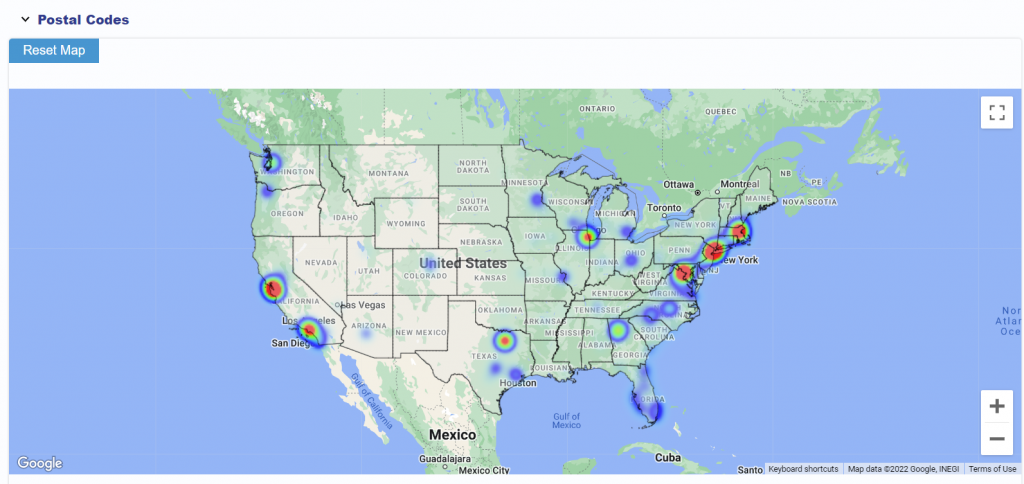
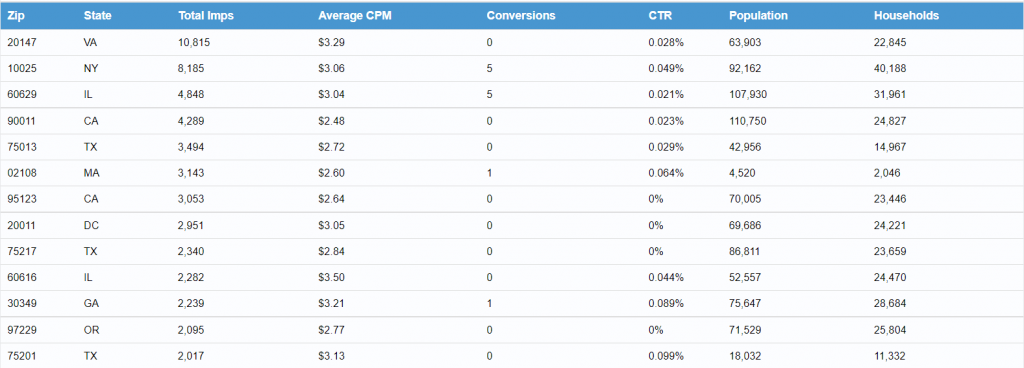
- Postal Codes: U.S. only
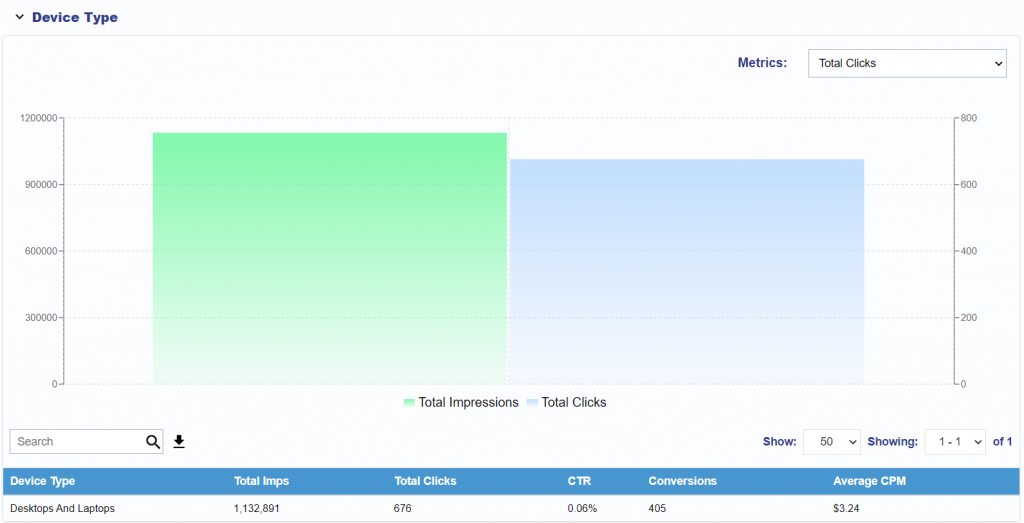
- Device Types: Desktops And Laptops, Mobile Phones, Tablets, TV, Game Console, Media Player , Set Top Box
- Geo: State, DMA or County (U.S. only)
Once you have selected the desired targeting parameters, click ‘Save Report’. The report status will appear as ‘Pending’ while the report is generating. Once the status has changed to ‘success’ you will be able to open the report and view the results.
Report Results:
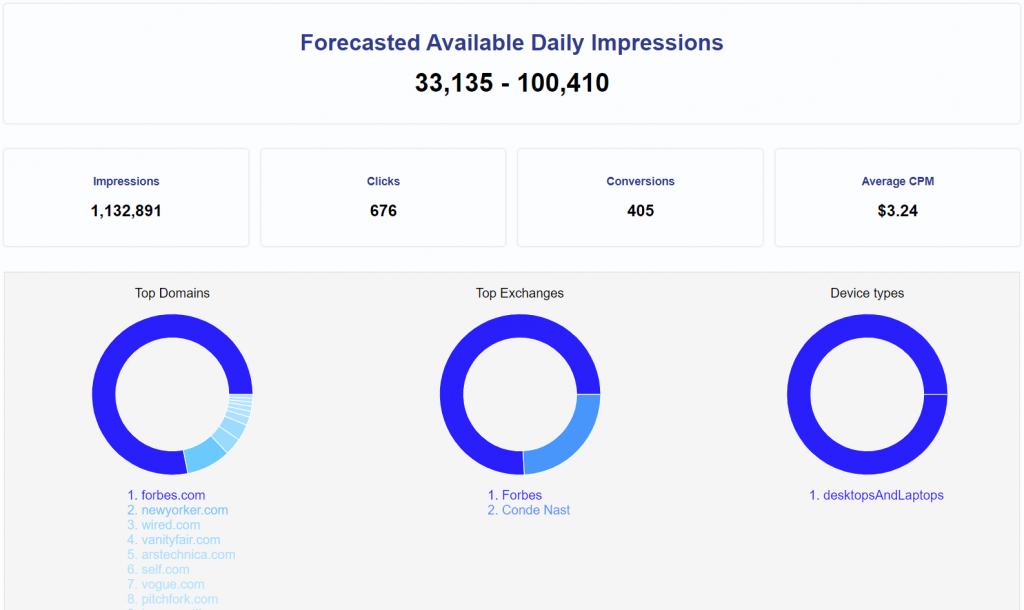
- Forecasted Available Impressions: This will display the estimated number of daily impressions available with the selected targeting parameters.
- Impressions: This number indicates historical delivery on the platform with the selected targeting parameters for the report dates.
- Clicks: The number of clicks on this inventory for the selected report dates.
- Conversions: The number of conversions on this inventory for the selected report dates.
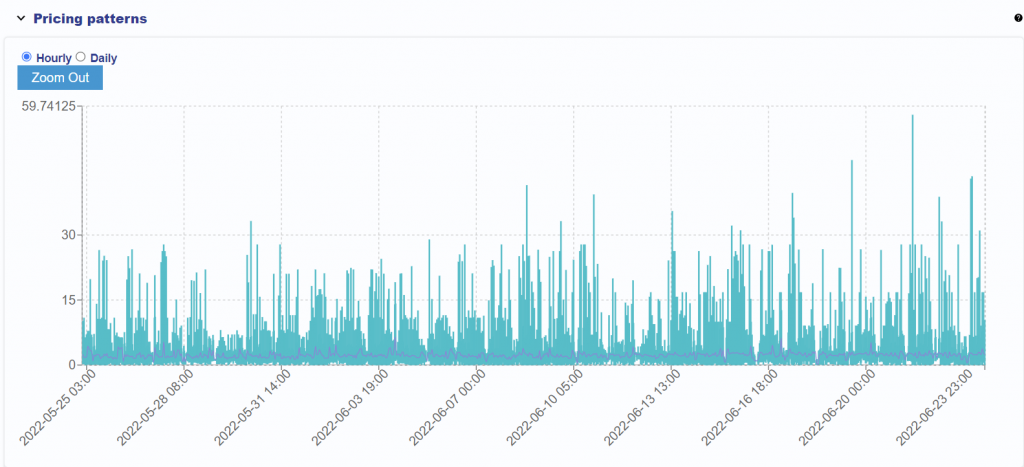
- Pricing Patterns: The chart depicts both hourly and daily pricing patterns for the last 30 days of delivery.
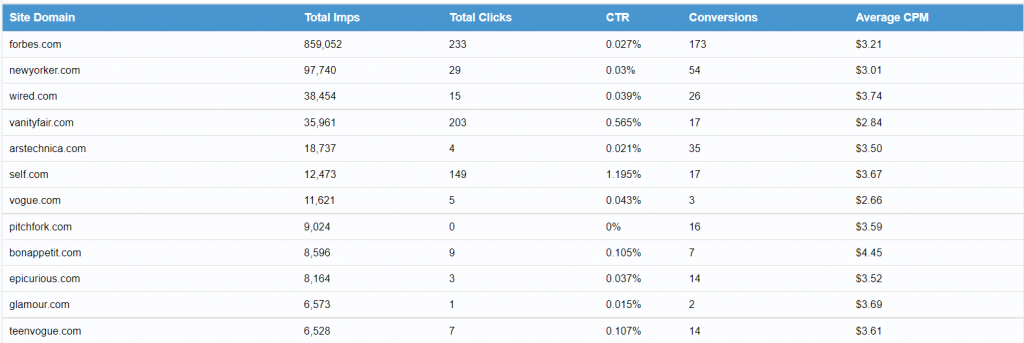
- Site Domain: Imps served, performance and pricing by domain for the selected report dates.
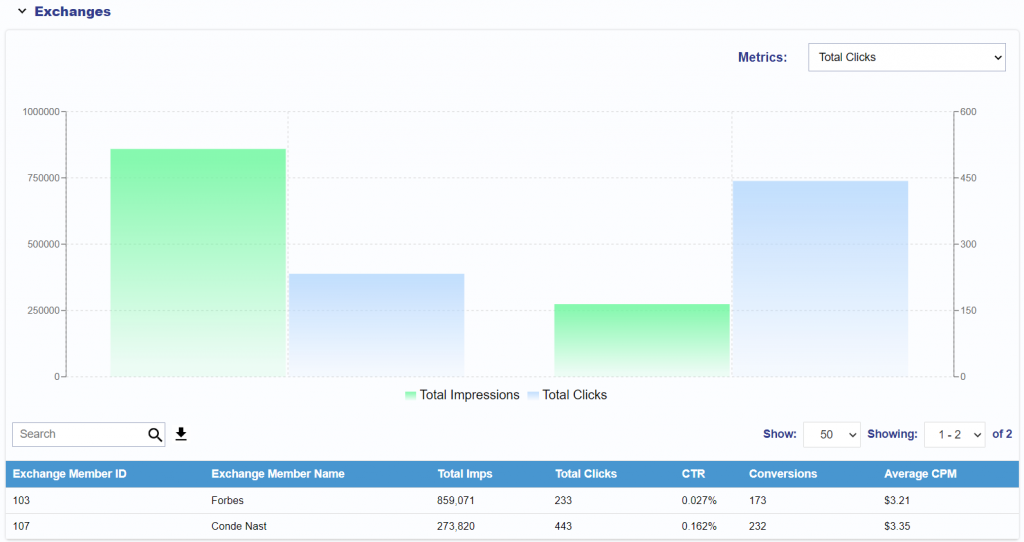
- Exchanges: Imps served, performance and pricing by exchange for the selected report dates.
- Device Types: Imps served, performance and pricing by device type for the selected report dates.
- Postal Codes: Imps served, performance and pricing by postal code for the selected report dates.
