The audience research tool enables users to locate & understand the highest value users to your brand by utilizing the traffic on your website, or a specific geo, to create detailed insight reports, and leverage look-a-like modeling to find new targets.
Define an existing audience of the brand:
From existing website traffic
OR from a specific geo that the grand has identified as high value or high performing for their product or service
Create a detailed insight report from the zip codes and US Census data to better understand demographics and characteristics of the existing audience
Through look-a-like modeling, find the zip codes that most closely match the existing audience
Export these zip codes for targeting across all media and channels
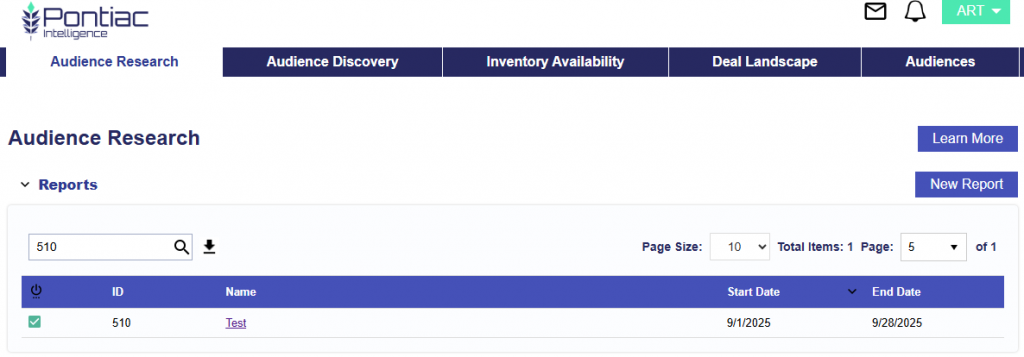
Create an Audience Research Report
Create an insight report from an existing audience to research their demographic characteristics, interests they are showing across the web and their streaming behaviors. The Audience Research tool makes all of this data easily accessible for the audience selected, and using this data creates a lookalike model to create an audience extension to the zip codes most closely matching the characteristics of the existing audience.
There are three types of audiences that can be used for the ‘source’ of an ART report:
Pixel Report: A Pixel report will pull audience insights from the visitors to the Advertiser’s website via an IP Pixel.
Geo Report: The Geo report will pull Audience insights from a list of U.S. zip codes. For example, if an advertiser has a zip code, DMA or city that is a top performer, you can select this geo and run a report to create a complete profile of users in that geo, then leverage a lookalike model to find similar zip codes for prospecting.
Contextual Report: The Contextual report will pull audience insights from a contextual AI audience or interest category. Create an insight report to better understand the demographics of users that are showing interest in a specific topic. To create a custom interest category, see here: Custom Interest Categories
To create a ‘Pixel’ Report, the first step is to create and place Pontiac IP pixels on the Advertiser’s website. Multiple pixels can be created to track each action or page on the website, or you can simply place one pixel on all pages to capture all site traffic. Reports can then be created from each individual pixel, or from several pixels combined, allowing you to segment insights in a way that best fits your needs.
In the Pontiac Platform select ‘DSP’ in the top right corner.
Create a new Advertiser or open an existing one.
Select ‘New IP Conversion Pixel’, give the pixel a name, and save.
Allow a few minutes for the pixel to generate, then click on the name of the pixel to view the code.
Place the pixel code on the Advertiser’s website. This can be placed on all pages, or on a specific page of interest. For example, if you place this pixel on the ‘Thank you’ page after a transaction is completed you will be able to create a profile of users that have made a purchase. If you place this pixel on all pages, you can create a profile of all users that visit your website.
Once the pixels have been placed you will need to allow time for the sample sizes to grow as visitors are seen on the page.
Log in to the Pontiac Platform and in the top right corner, click on the button ‘ART’.
Select the blue ‘New Report’ button.
Give the Report a name.
Select the target audience size from 1,000 Zip Codes, 2,500 Zip Codes, 5,000 Zip Codes, or 10,000 Zip Codes. This is the number of matched zip codes that will be returned by the lookalike model.
Select an Auto Refresh schedule if needed. If an audience is published from the report, this will update the report and the audience on the selected schedule. New interest data is ingested every 30 days so refreshing the audience will incorporate any new data that has been added.
Select the ‘Audience Type’.
For ‘Pixel’ Audiences, associate the pixel or pixels to build the report from. This is an IP Pixel that must first be created in the DSP section of the platform, then placed on the Advertiser’s website. Once your IP pixel has been placed and the sample size has grown over time, you can create insight reports from this data.
For ‘Geo’ Audiences, add the list of U.S. zip codes to build the report from.
For Contextual Audience, select a Contextual audience or Interest category from the list. Custom interest categories will need to be created in the DSP platform, prior to making a report. See more here: Custom Interest Categories
For Pixel reports – Enter the dates that you want the report to pull from. This will pull the IP addresses of visitors to your website during this date range. The maximum lookback period is 6 months.
Select the categories or characteristics that you would like to research for your audience. Select the demographic categories from ‘Demographics’ or ‘Focused Demos’ sections. For topics of interest, select from ‘Interest’ categories to understand the types of content that your audience is showing interest in. There is a limit of 10 categories that can be selected per report.
Apply filters to the lookalike audience if you would only like to receive zip codes within a specified geo or above a certain population threshold. For example, if your campaign is set to only run in New York you can limit the lookalike audience to the top zip codes in New York that resemble your existing audience.
‘Submit New Report’ to generate the Report.
ART Report Data
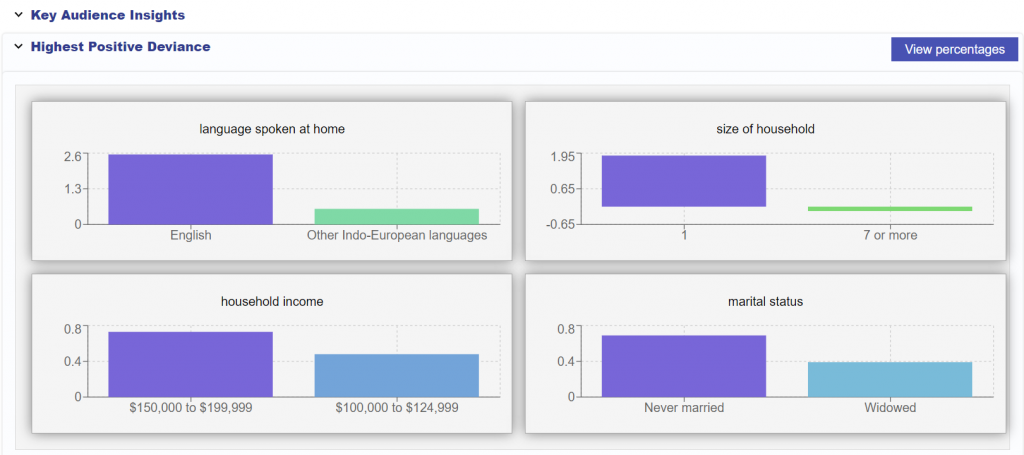
Key Audience Insights
The highest positive deviance section of the ART report will display the key characteristics that are the most defining demographics or interests for your audience:
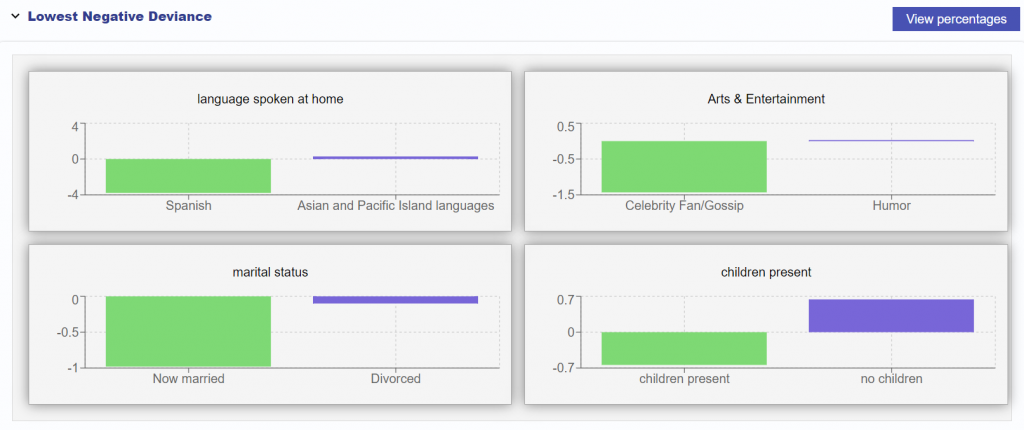
The lowest negative deviance section of the ART report will display the key characteristics that are the least defining demographics or interests for your audience:
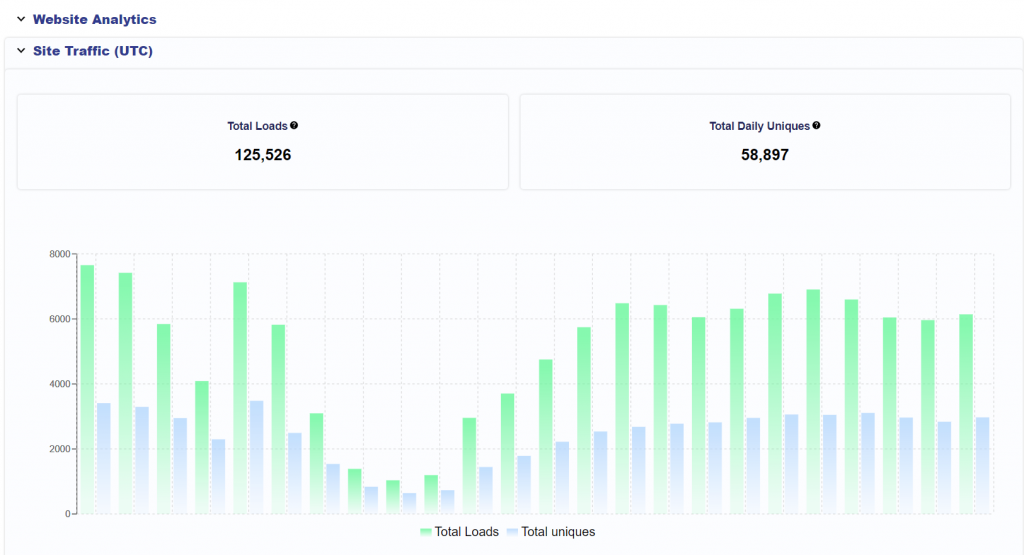
Site Traffic Analytics
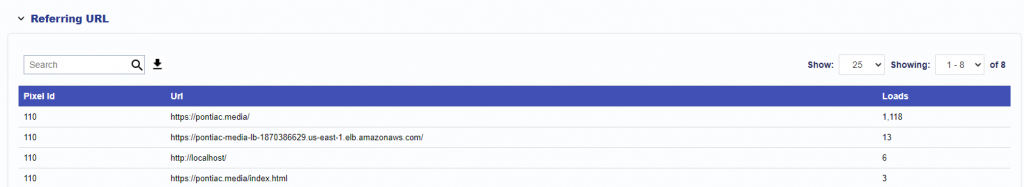
Referring URL
The Referring URL section of the report will provide additional website analytics, displaying the URL that the user was on when the pixel load occurred.
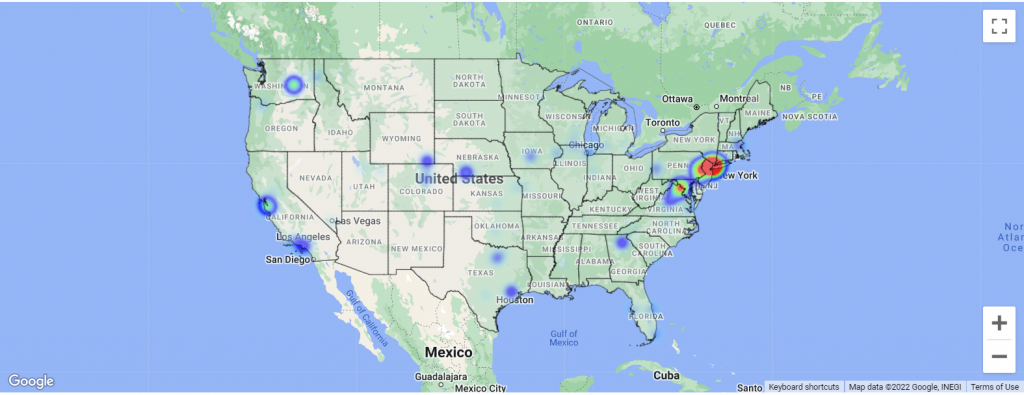
Geographic Data
Once your report has generated, you will see a heat map displaying the geographic areas where your site traffic comes from. Below the map, there is a list of states and the percentage of website visitors that come from each state. Expand each state to see the percentage of traffic at the zip code level, their populations and number of households.
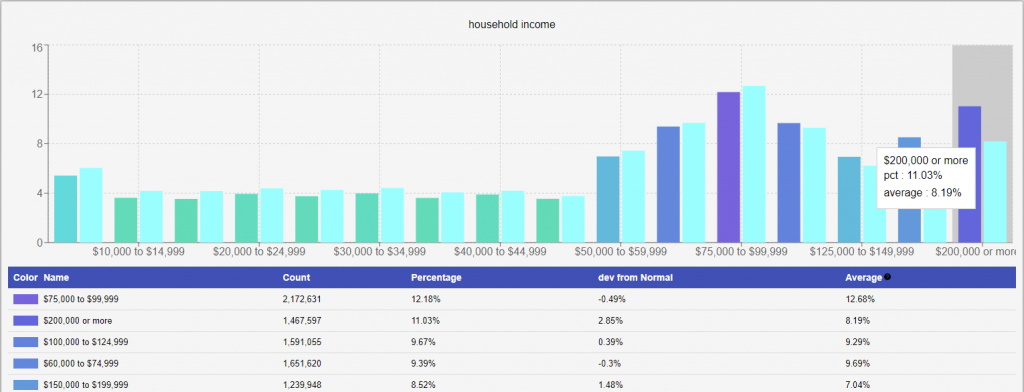
Demographic Data
ART will create a report of the selected data categories utilizing U.S. Census data and the geographic data generated by your IP pixel. The report will be broken down into sections by ‘Concept’ and each concept will contain several graphs. For example, the Concept ‘Households’ will display graphs with the number of children present, the martial status, the household income and the size of household in the zip codes that your users come from.
Each graph will display the % of users in that zip code for each demographic category, as well as compare that percentage to the national average. A zip code is considered ‘exceptional’ in a specific category if the % of users in this category is higher than the national average. In this example below, the zip code selected over-indexes for household income of $200,000 or more as 11.03% of individuals fall into this bracket, while the national average is only 8.19%.
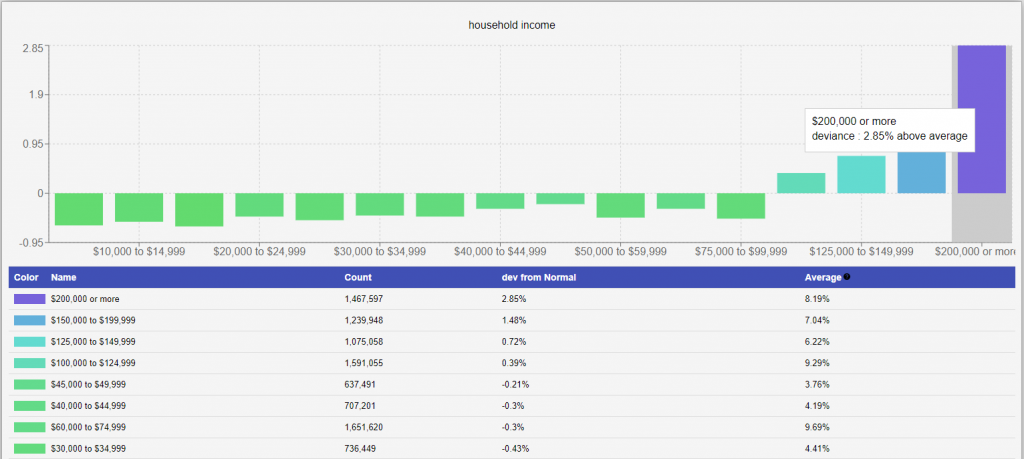
Use the ‘View Deviance’ button to view the deviance for this zip code from the national average. The higher the deviance, the more exceptional a zip code is for a specific demographic:
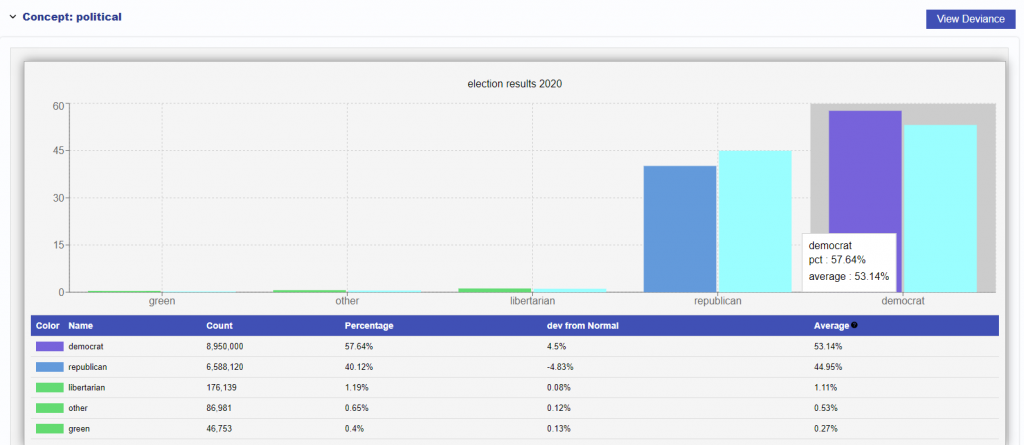
Political Data
Political Data is also available for the 2020 presidential election. This data comes from Harvard Dataverse.
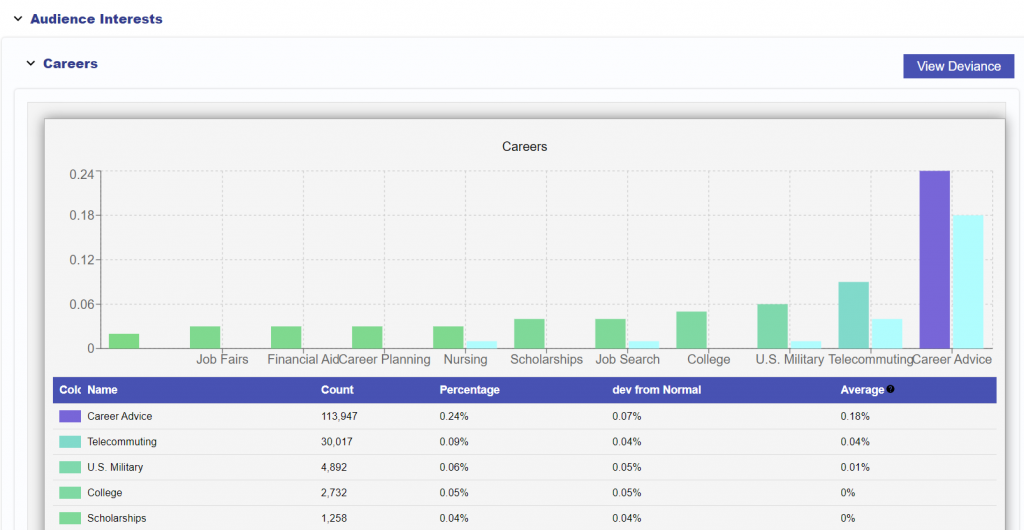
Interest Data
Through AI-based contextual analysis, Pontiac identifies categories of content consumed by zip code across the U.S., then matches this data to the zip codes of your existing audience for insights into the topics your website visitors are reading about. Leverage interests in content to develop cookieless contextual targeting strategies that are most relevant to your target audience. For example, in the below report the Advertiser’s audience is showing above average interest in Career Advice:
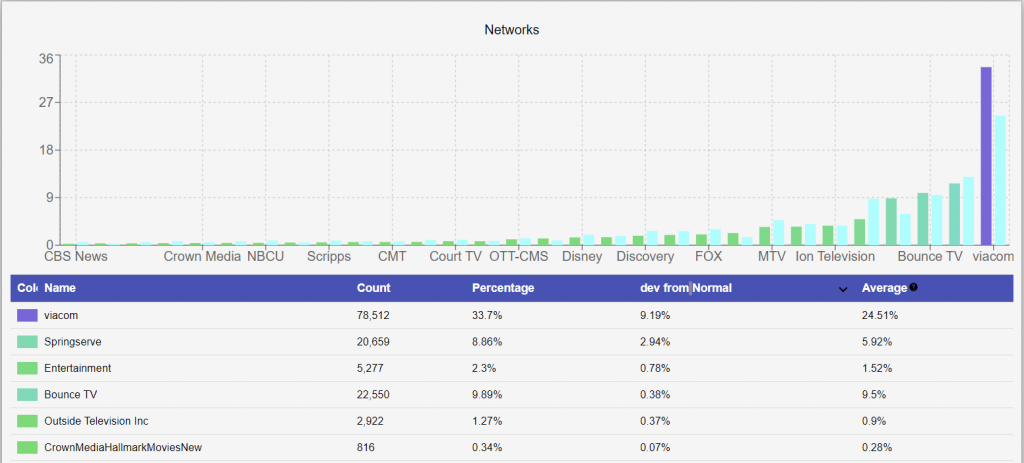
Inventory Data
In the Inventory Data section of reports you can review the specific CTV networks, publishers, channels, series, episode titles & apps that your audience is currently watching. Our CTV Bidder provides the capabilities for targeting down to the channel level, so these are all actionable insights. Build detailed CTV targeting plans to serve ads across the inventory your audience watches the most.
Here is a sample model for CTV Network viewership for Mother’s in Louisiana with high household income that are showing interest in boating:
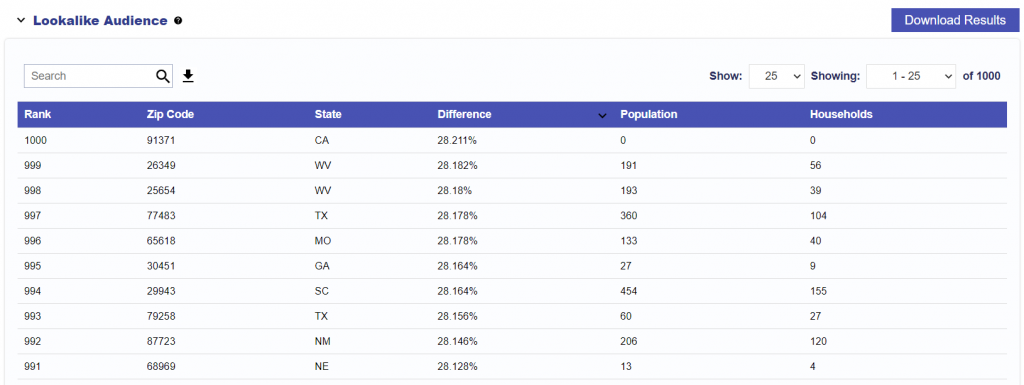
Lookalike Modeling through Zip Code Correlation
By building a look-a-like model from your existing web traffic, the geo selected or the interest category, the report will output a list of new zip code targets that are most closely matched to your existing audience across the categories and characteristics selected. Select ‘Publish Audience’ at the bottom of the report to create a cookieless targeting solution across all channels and media types – from Display and CTV to Digital Out of Home. Reports will also include the population and number of households in each zip code to provide insight into the potential audience size.