Audience Discovery Report Data
The report is broken apart into different sections: audience insights, audience interests, inventory and published audiences. Follow the Extreme Sports Fans Audience Discovery Report to understand each section of the report. Note that the Audience Discovery Report setup is as follows:
- Name: Extreme Sports Fans
- Target Audience Size: 1000 Zip Codes
- Audience Description: Fans of BMX
- Targeting > Interests > Sports: Mountain biking, Surfing/body-boarding, Bicycling, Snowboarding, Skateboarding, Power & motorcycles
- Filters > Population: Population greater than 1000, Households greater than 400
- Filters > Traffic Filtering: Zip Traffic greater than 1000, Graph Traffic greater than 20, Category Traffic greater than 2
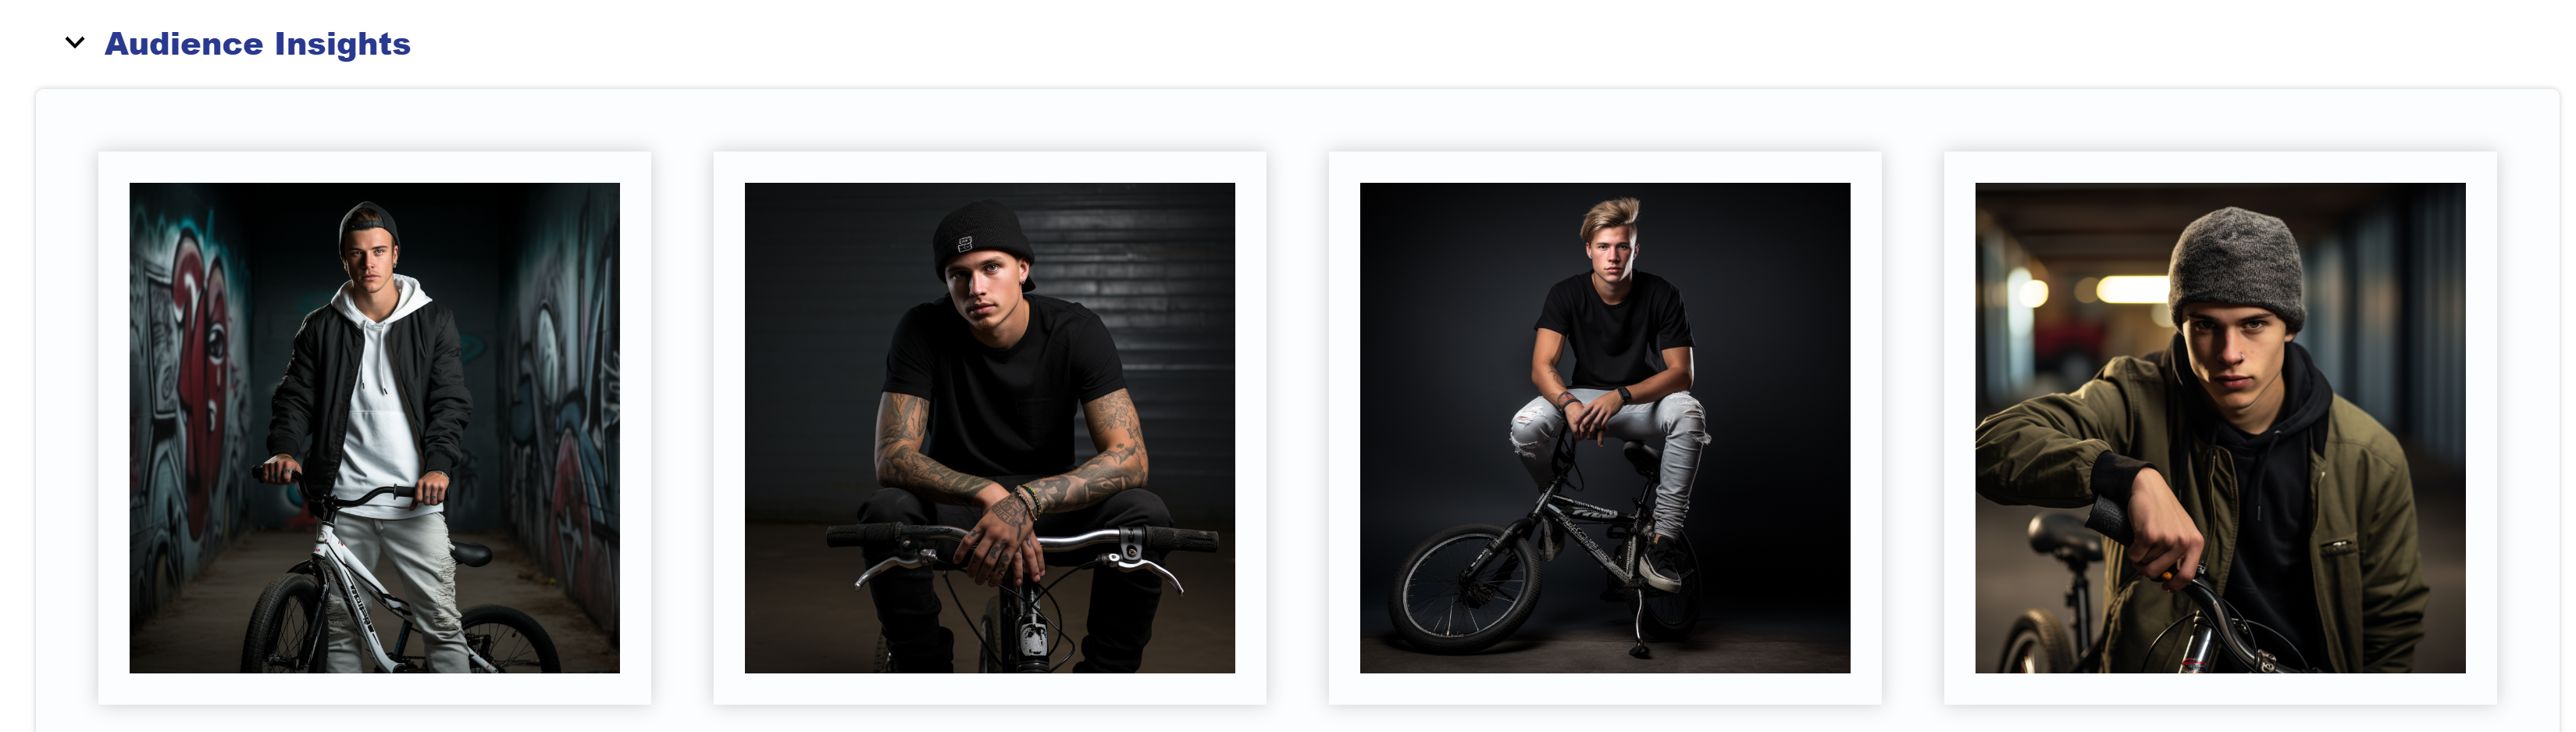
Audience Insights
If you added a description when generating the audience discovery report, four AI generated images of your target audience will be displayed. These images help paint the picture of who you’re targeting. In our example, the audience description is “Fans of BMX” and the bellow figures were output.
A heat map displays the geographic areas across the United States with the highest variance from the U.S. average on the selected variables. Below the map, the zip codes will be ranked according to their propensity match to your desired demographics and interests, with #1 being the closest match.
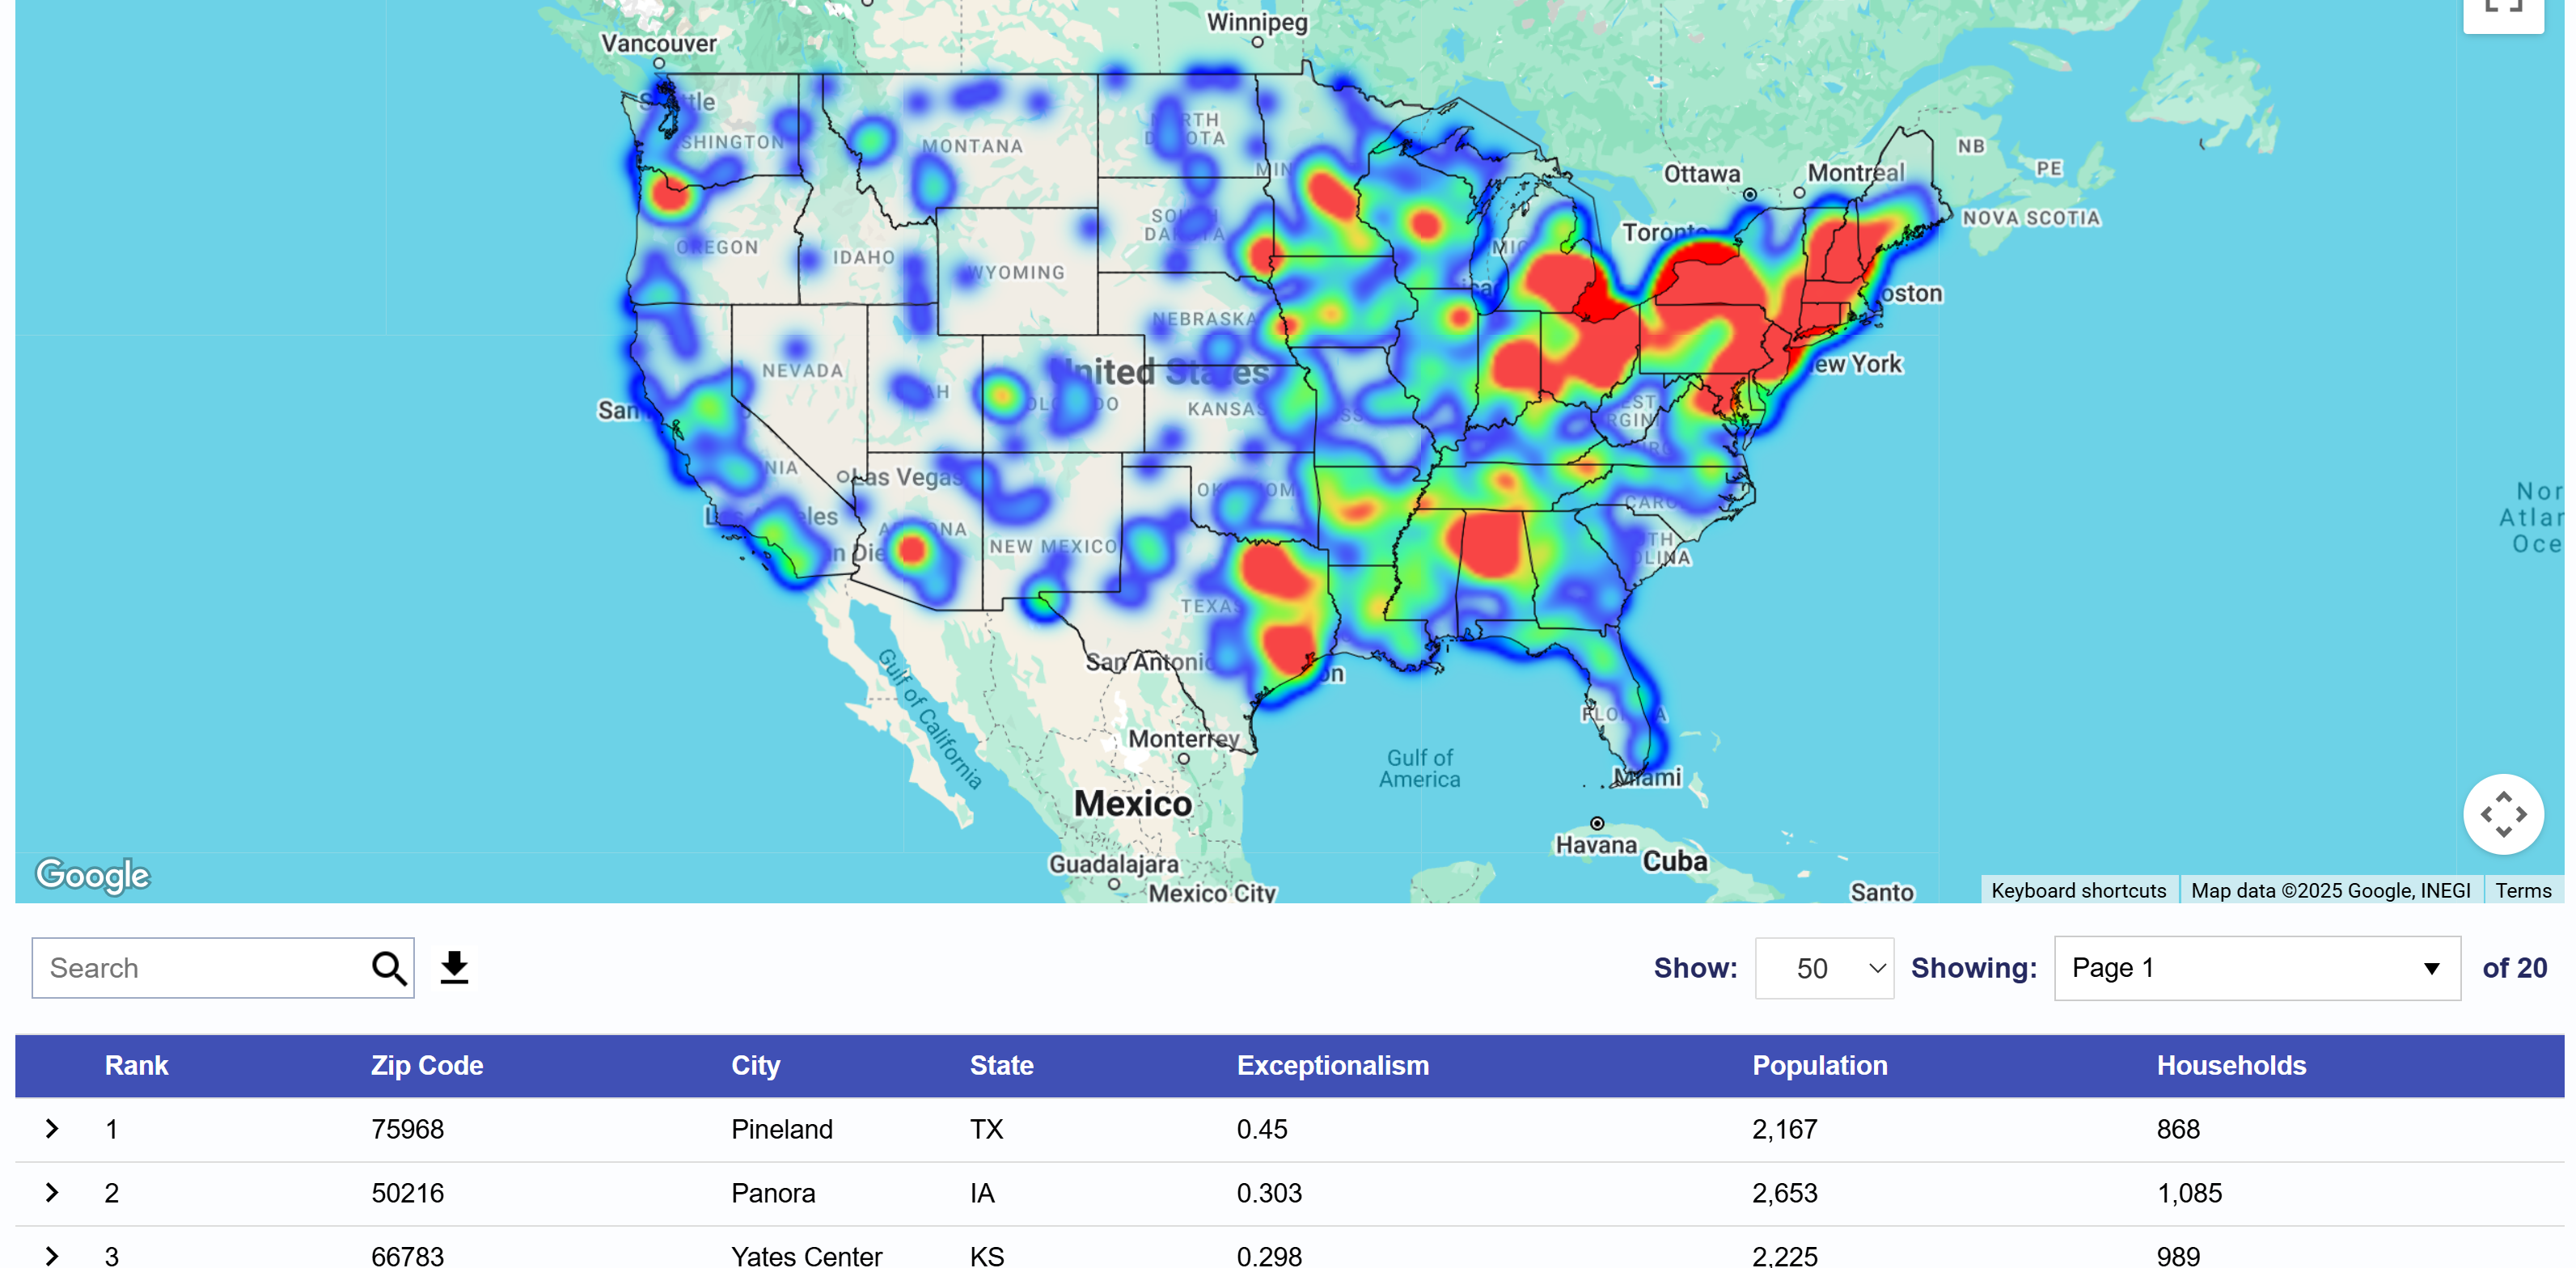
The ‘Exceptionalism’ column will display the average percentage difference between the displayed zip code and the U.S. average across all selected variables. A higher difference will indicate a higher likelihood for the zip code population to meet the criterion selected. Use the download button to export the list of zip codes. This zip code list can then be used for targeting on Pontiac campaigns across all channels and media types.
In this table, the report will also display the population and number of households for each zip code to provide insight into the potential audience size and reach of your campaign targeting these zip codes.
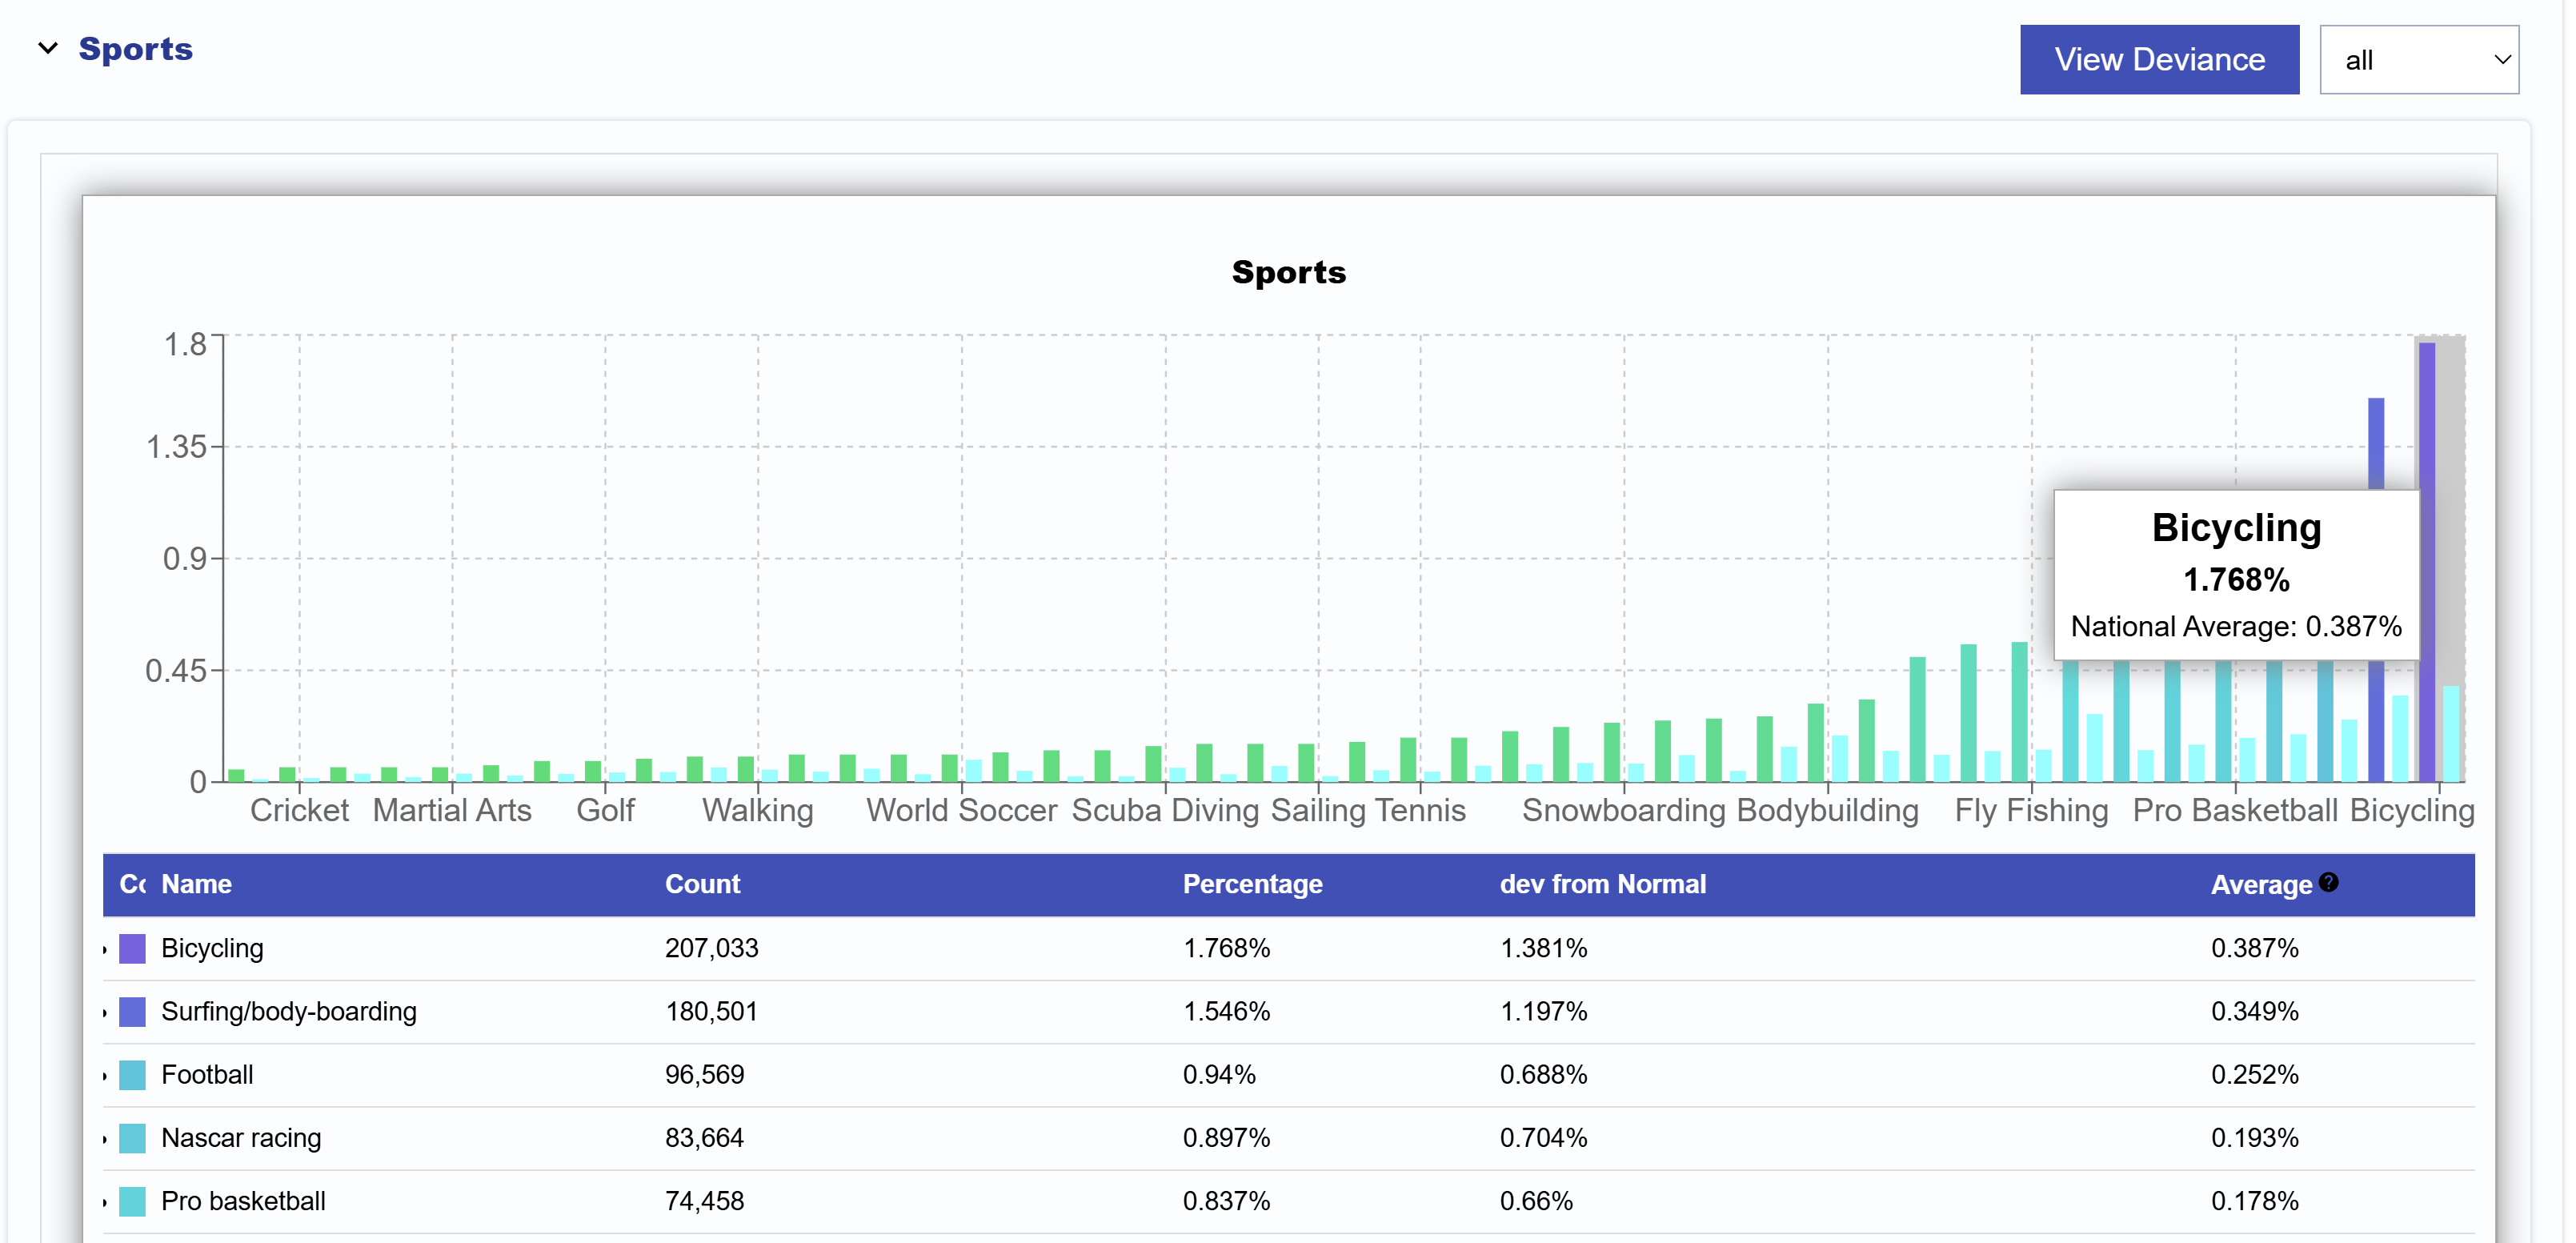
Audience Interest
In the Audience Interest expandable section, you will see graphs of your selected targeting. Displayed is the distribution of the the population in the returned zip codes across each of the selected demographic and interest variables. Based on our example, we selected a variety of sports. Hover over the graph to see the name and corresponding percentage, deviation from normal, and US average. The category with the highest deviation from normal means that it is more likely to appear in this target audience. In our example, our audience is interested in Bicycling, Surfing/body-boarding, and Football the most.
Note that in the top right corner, users can toggle between Deviance and Percentage views depending on needs and interpretability. Users can also select to show all data points, top 10%, top 20%, or top 50%.
Inventory
In the Inventory section of reports you can review the specific CTV Title, Series, Genres, Channels, Publishers, Networks, and Apps that your audience is currently watching. Our CTV Bidder provides the capabilities for targeting down to the title level, so these are all actionable insights that can be applied to your Campaigns. Build detailed CTV targeting plans to serve ads across the inventory your audience watches the most.
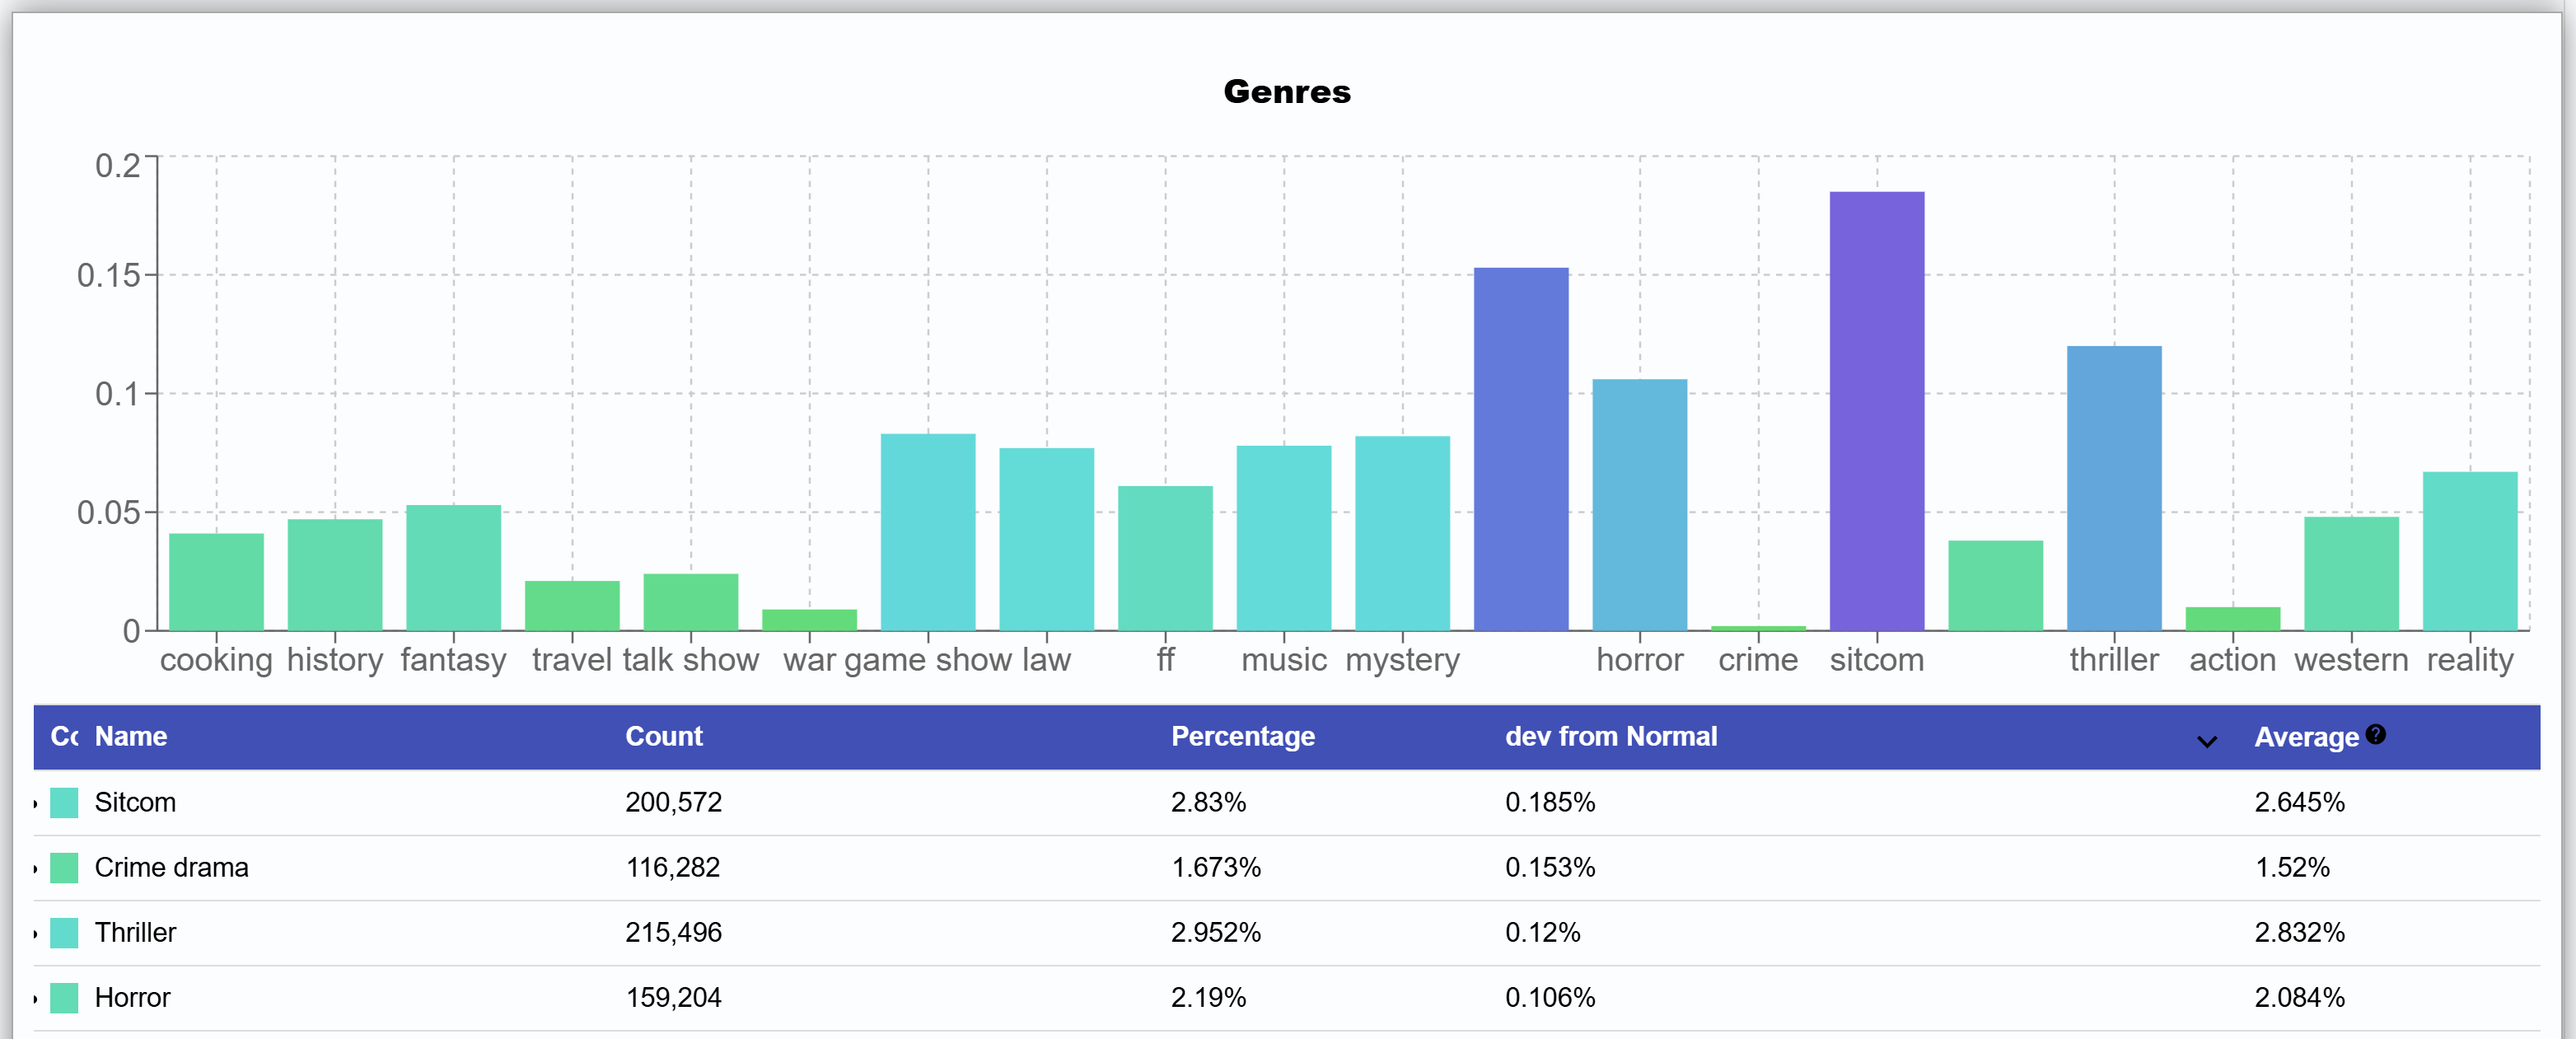
Here is a sample model for CTV Genres viewership for extreme sports fans:
Looking at the graph in the percentage view, the light blue columns on the graph display the national average for each demographic or interest category (Sitcom, Crime drama, Thriller, etc.). A zip code is considered exceptional in a category if the % of users in that category for the zip code is higher than the national average. This is calculated in the ‘Dev from Normal’ column.

Switch the graph type using the ‘View Deviance’ button to view how a zip code or the complete set of zip codes differs from the national average on each category.
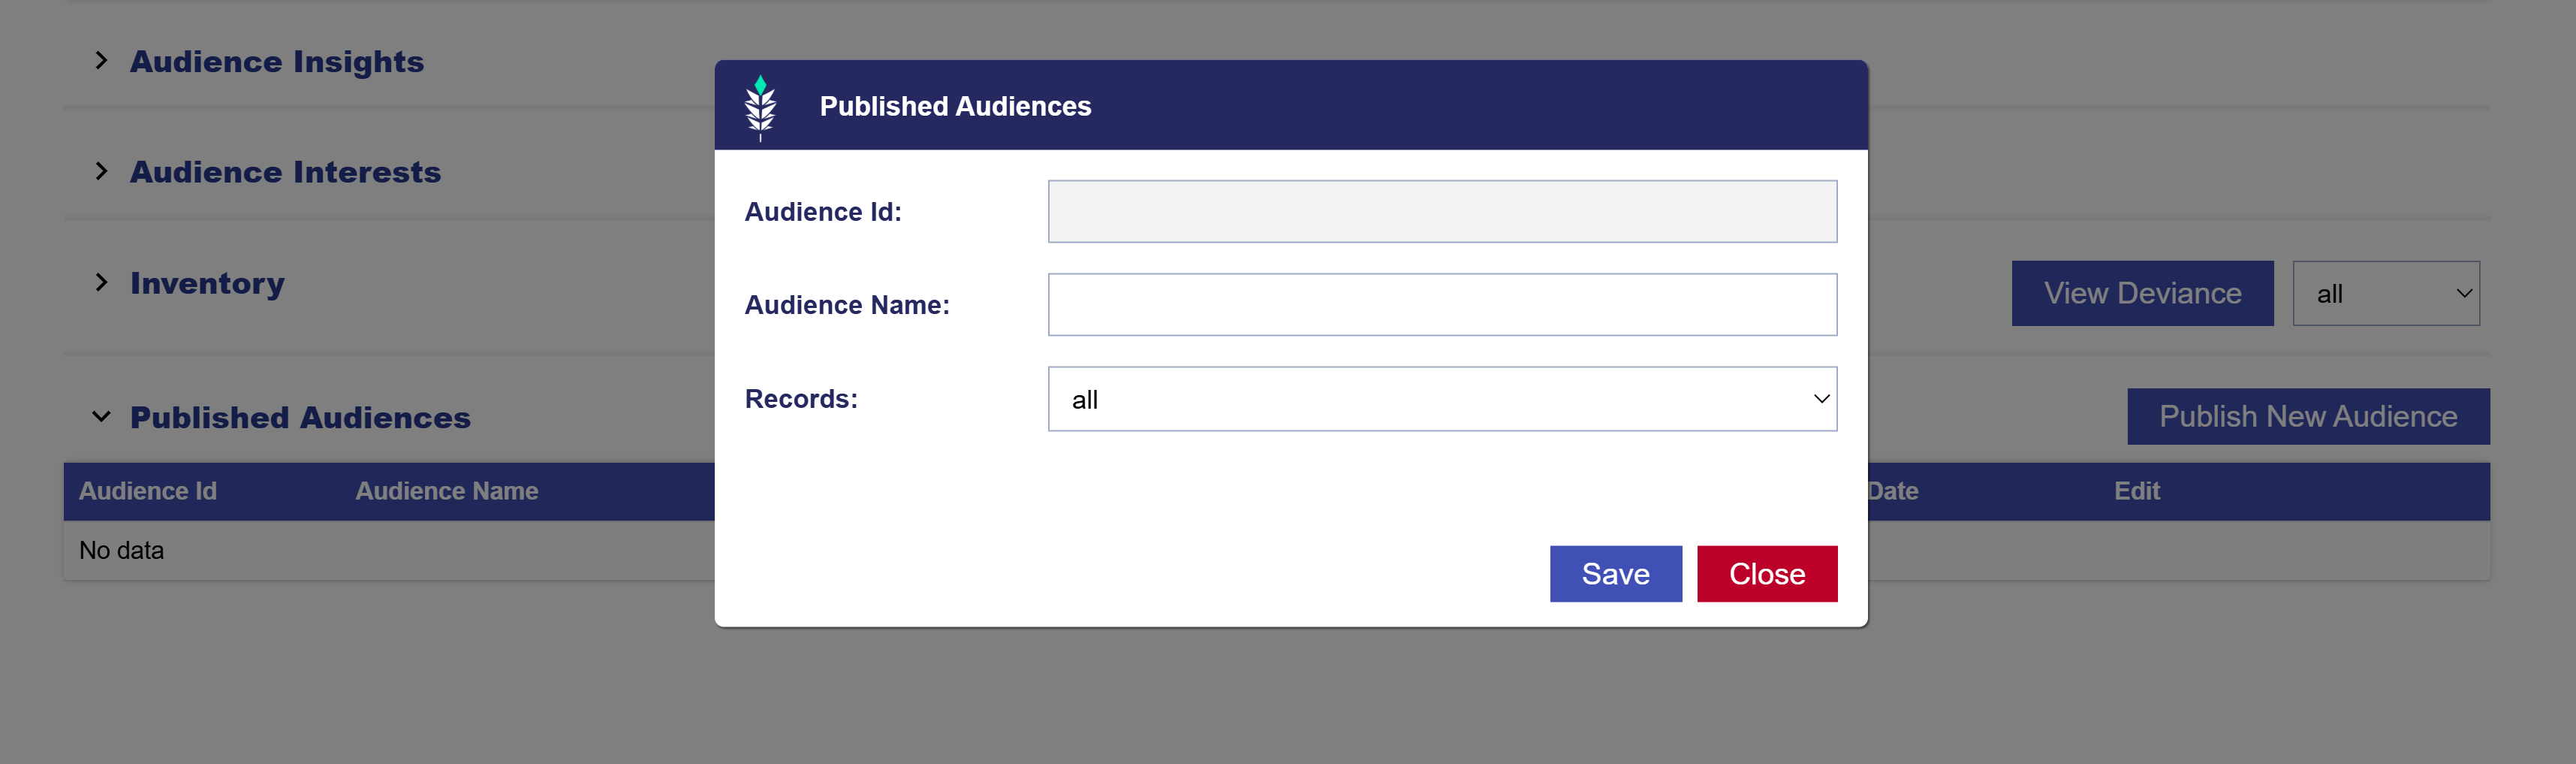
Published Audiences
To create a targetable audience from the report data, click the ‘Publish Audience’ button. This will give you the option to select the threshold of match you want to include in the export. Filter results to select ‘all results’ or the ‘top 10%’, ‘top 20%’, ‘top 50%’ of matched zip codes depending on how closely matched you would like the zip codes to be. This audience will then be readily available for targeting in any Line Item under Custom ART Audiences.