Report Results
The Incrementality Reports results include the pipeline used, date created, when the report started, and when the reported completed. The output is separated into 5 sections:
- Summary
- Dashboard
- Explorer
- Charts
- Downloads
This information provides a complete audit trail and transparency into the model, allowing users to understand how results are generated and directly tie insights back to campaign performance, rather than relying on a black-box approach.
Summary
The Summary section provides a high-level overview of the analysis, including the Report ID, Advertiser ID, and Date Range, along with an automatically generated Executive Summary. The Executive Summary explains what is driving incremental performance and highlights where advertising is creating true lift, helping inform optimization decisions using model-based predictions.
Tip: You can input the Executive Summary into your preferred LLM (e.g., ChatGPT or Claude) to quickly generate a presentation deck or case study based on the results.
Dashboard
The Dashboard provides a visual overview of incremental lift and true campaign impact, comparing exposed users (who saw ads) against a matched control group (who did not).
- Exposed Group: Unique IPs served ads, matched to pixel fires where the ad was shown before conversion within the lookback window
- Control Group: 1% random sample of bid stream IPs in the same ZIPs and deal IDs, not served ads, matched to the same pixel fires
ZIP codes are filtered to within 1 standard deviation of mean impression volume to ensure reliable comparisons.
The model classifies ZIPs into:
- Scale: Strong positive lift with high confidence
- Observe: Moderate or emerging signal
- Ignore: No measurable incremental impact
- Block: Negative lift
Dashboard Sections:
- Tile Metrics
- ZIP Classification — Scale / Observe / Ignore / Block
- Geographic Analysis
- Top Scale ZIPs — Incremental Conversions
- Lift Distribution Across ZIPs
- Exposed vs Control — Conversion Rate by ZIP
- Ad Impact by ZIP — Control vs Exposed Conversion Rate
Tile Metrics
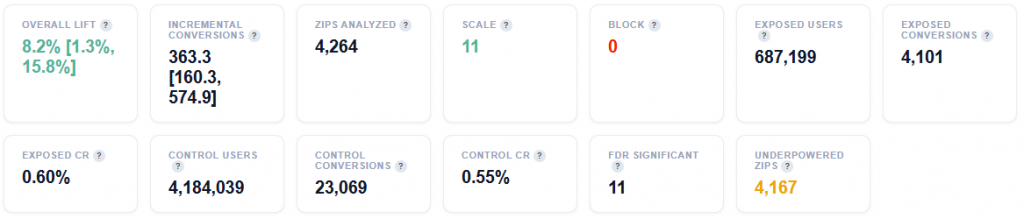

- Overall Lift: Percentage increase in conversion rate for users who saw ads versus those who did not. Positive = ads are driving incremental impact. Range in brackets is the 95% bootstrap confidence interval.
- Incremental Conversions: Estimated conversions that would NOT have happened without advertising. Range in brackets is the 95% bootstrap confidence interval.
- ZIPs Analyzed: ZIP codes with impression volume within 1 standard deviation of the mean – statistically meaningful sample sizes.
- Scale: ZIPs with high positive lift and high confidence – increase budget here.
- Block: ZIPs with negative or zero lift – ads are not working here, stop spending.
- Exposed Users: Unique IPs served ads by this campaign.
- Exposed Conversions: Unique exposed IPs that fired the pixel AFTER being served an ad (within lookback window). Matched via pixel server logs.
- Exposed CR: Conversion rate for the exposed group (Exposed Conversions / Exposed Users).
- Control Users: Unique IPs from 1% sample bid steam in the same ZIPs and deal IDs, NOT served ads by this campaign.
- Control Conversions: Unique control IPs that fired the pixel AFTER their sample request (within lookback window). Same pixel server log source as exposed – apples to apples comparison.
- Control CR: Conversion rate for the control group (Control Conversions / Control Users). This is the baseline organic conversion rate.
- FDR Significant: ZIPs that pass Benjamini-Hochberg FDR correction at 10% – these lift estimates are statistically reliable after correcting for multiple comparisons.
- Underpowered ZIPs: ZIPs where sample size is too small to detect the observed lift reliably (lift < minimum detectable effect). These are classified as Observe regardless of lift magnitude.
- Incremental CPA: True cost per conversion caused by advertising: (Spend / Incremental Conversions. This is the honest acquisition cost – excludes conversions that may have happened anyway.
- Standard CPA: Traditional cost per conversion: (Spend / All Conversions). Lower than incremental CPA because it counts conversions that would have happened possibly without ads.
- CPA Inflation: How much higher the true (incremental) CPA is vs standard CPA. A factor of 2x means that the real cost of acquiring a customer is twice what standard reporting suggests.
- Total Spend: The total media spend across al ZIPs (full volume, no down sampling).
ZIP Classification — Scale / Observe / Ignore / Block
This section categorizes ZIP codes based on incremental lift and statistical confidence, helping identify where advertising is driving real impact and where it is not. Each ZIP is classified based on its lift magnitude, statistical confidence, and sample quality. Scale indicates high lift with strong confidence, while Block reflects negative lift or no measurable effect.
Chart View
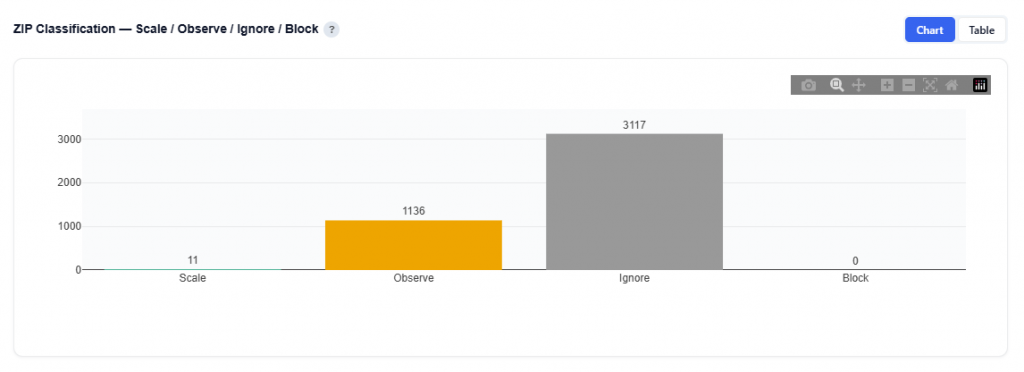
What It Shows
- Each ZIP is classified into one of four groups based on:
- Lift magnitude (positive or negative impact)
- Statistical confidence (reliability of the result)
Classification Definitions
- Scale: ZIPs with strong positive lift and high statistical confidence
- Proven to drive incremental conversions
- Best candidates for increased budget and expansion
- Observe: ZIPs with moderate or emerging signals
- Potential to perform well but require more data
- Suitable for continued testing and monitoring
- Ignore: ZIPs with no measurable incremental impact
- Conversions likely occurring organically
- Candidates for reduced spend or deprioritize
- Block: ZIPs with negative lift
- Advertising may be harming performance
- Should be excluded from targeting
Table View
This table provides the full ZIP-level output of the incrementality model, combining exposure data, lift measurement, statistical confidence, and cost efficiency. Users can download this table as a CSV file for further analysis.
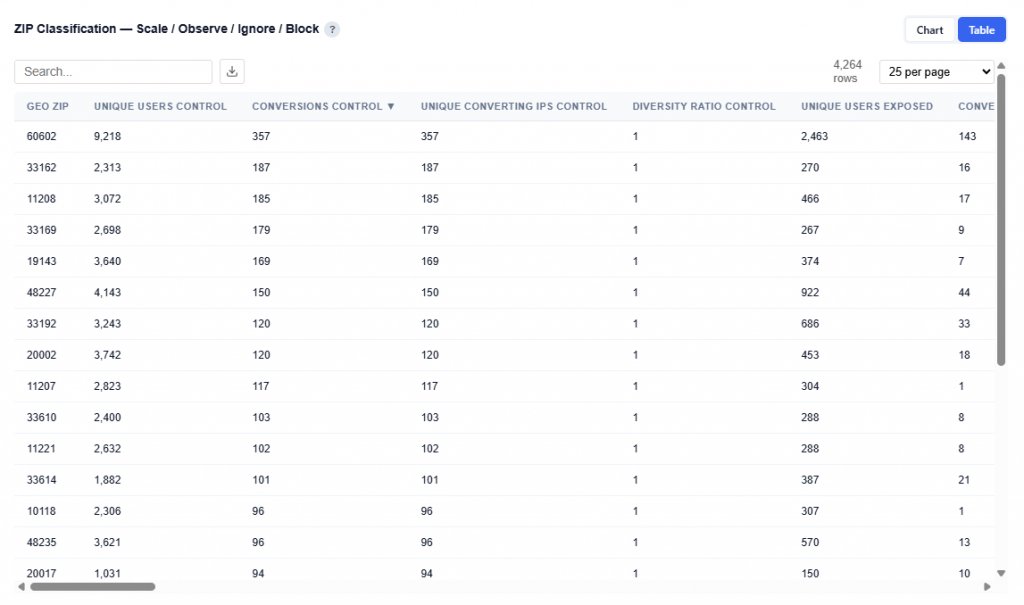
Columns:
- Geo ZIP: ZIP code being evaluated
- Unique Users Control: Number of users not served ads
- Conversions Control: Total conversions from control group
- Unique Converting IPs Control: Unique converters in control group
- Diversity Ratio Control: Distribution of conversions across users in control group
- Unique Users Exposed: Number of users served ads
- Conversions Exposed: Total conversions from exposed users
- Unique Converting IPs Exposed: Unique converters in exposed group
- Diversity Ratio Exposed: Distribution of conversions across users in exposed group
- CR Control Raw: Raw conversion rate for control group
- CR Exposed Raw: Raw conversion rate for exposed users
- Raw Lift: Difference between exposed and control conversion rates
- Diversity Valid Exposed: Whether exposed data passes diversity validation checks
- Diversity Confidence: Confidence in diversity-based data reliability
- CR Control Bayes: Bayesian-adjusted conversion rate for control group
- CR Exposed Bayes: Bayesian-adjusted conversion rate for exposed users
- CR Control CI Low: Lower bound of control conversion rate confidence interval
- CR Control CI High: Upper bound of control conversion rate confidence interval
- CR Exposed CI Low: Lower bound of exposed conversion rate confidence interval
- CR Exposed CI High: Upper bound of exposed conversion rate confidence interval
- Lift Bayes: Modeled incremental lift (preferred lift metric)
- Incremental Conversions: Estimated conversions driven by advertising
- Lift Confidence: Confidence level of the lift estimate
- Relative Lift: Percent increase in conversion rate vs control
- Probability Positive: Probability that lift is positive
- Probability Large Positive: Probability of strong positive lift
- Probability Negative: Probability that lift is negative
- Expected Lift: Average expected lift value
- Lift Std: Standard deviation of lift
- Lift 5th Percentile: Lower bound of lift estimate range
- Lift 95th Percentile: Upper bound of lift estimate range
- Expected Value: Expected economic value generated by lift
- Value Std: Standard deviation of expected value
- Probability Profitable: Probability that the ZIP is profitable
- Value 5th Percentile: Lower bound of expected value
- Value 95th Percentile: Upper bound of expected value
- Sample Adequacy Score: Score indicating if sample size is sufficient
- Incremental Conv CI Low: Lower bound of incremental conversions
- Incremental Conv CI High: Upper bound of incremental conversions
- Classification: Final label (Scale, Observe, Ignore, Block)
- P Adjusted: P-value adjusted for multiple comparisons
- FDR Significant: Whether result is statistically significant after correction
- Min Detectable Lift: Minimum lift detectable with current sample size
- Lift vs Avg: Lift relative to campaign average
- Unique IPs: Total unique users observed
- Score: Model-derived ranking score for prioritization
- City: City name
- State ID: State abbreviation
- Total Spend: Total spend in the ZIP
- CPM: Cost per thousand impressions
- Total Impressions: Total impressions served
- Incremental CPA: Cost per incremental conversion
- Standard CPA: Traditional cost per conversion
Geographic Analysis
This section visualizes ZIP-level performance, showing how incremental impact varies across locations.
Each dot represents an analyzed ZIP code, allowing you to quickly identify where advertising is working and where it is not.
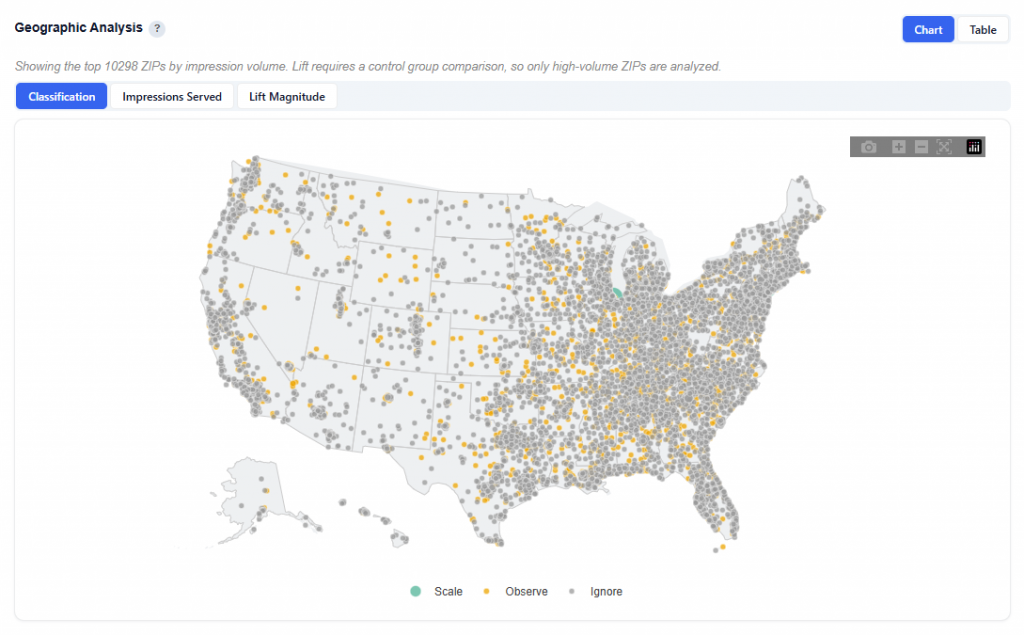
Toggle Views:
- Classification: Colors ZIPs by Scale, Observe, Ignore, Block
- Quickly identify high- and low-performing markets
- Impressions Served: Dot size represents user volume / impressions
- Larger dots = more reach and spend
- Lift Magnitude: Color represents direction and strength of lift
- Green lift (positive) = stronger incremental impact
- Red lift (negative) = underperformance
Classification
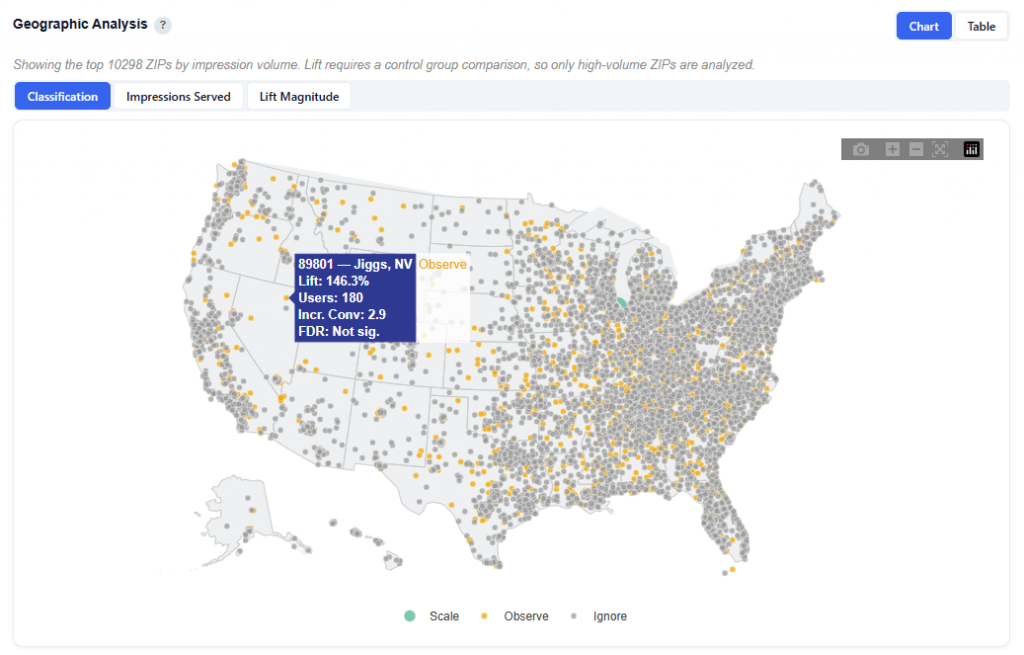
What It Shows:
- Quickly identify where to scale (Scale) and where to monitor (Observe and Ignore)
- Look for clusters of Scale ZIPs to find high-performing regions
- Use alongside other views to understand both performance and scale
Hover Data:
- ZIP code, name and state
- Lift: Lift relative to the analysis’s average
- Users: Unique users exposed to in that ZIP
- Incremental Conversions: The number of additional conversions driven by the ad
- FDR Significance: Indicates whether the lift is statistically reliable
Impressions Served
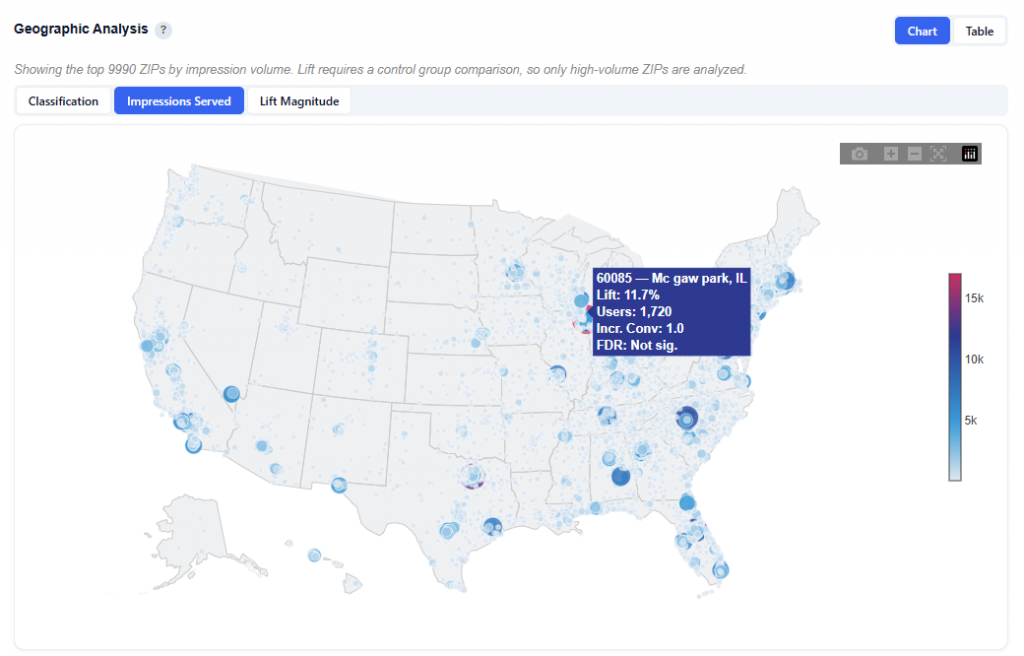
What It Shows:
- Dot size represents impressions served
- Color scale reflects Lift vs. Average intensity:
- Light blue = below average / negative lift
- Red = above average / positive lift
Hover Data:
- ZIP code, name and state
- Lift: Lift relative to the analysis’s average
- Users: Unique users exposed to in that ZIP
- Incremental Conversions: The number of additional conversions driven by the ad
- FDR Significance: Indicates whether the lift is statistically reliable
Lift Magnitude
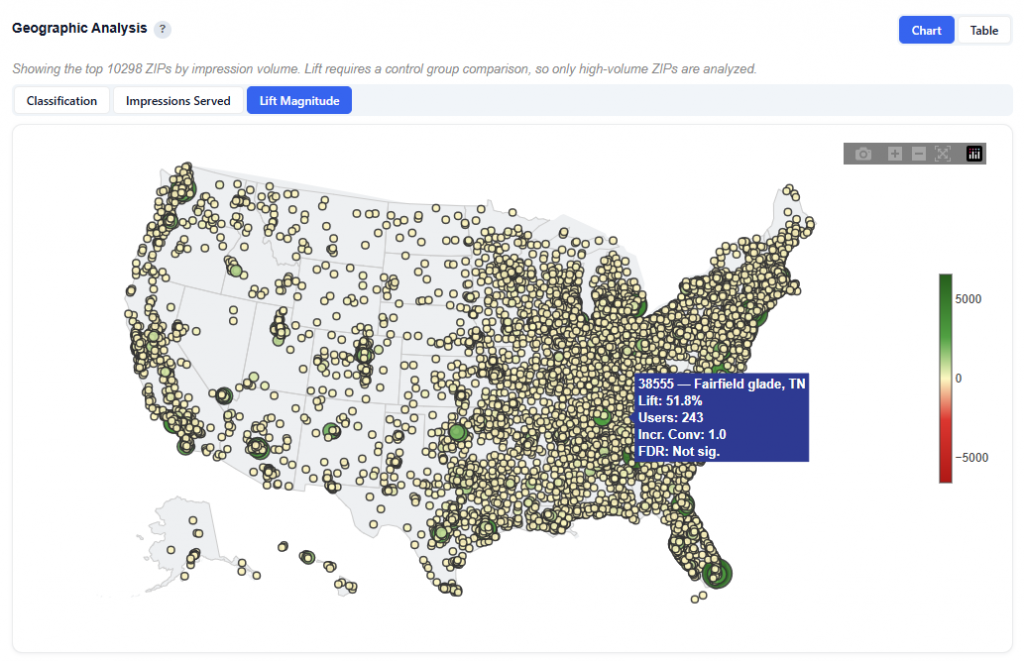
What It Shows:
- Color represents direction and strength of lift
- Green (Positive) lift = ads are driving incremental conversions
- Red (Negative) lift = ads are underperforming
Hover Data:
- ZIP code, name and state
- Lift: Lift relative to the analysis’s average
- Users: Unique users exposed to in that ZIP
- Incremental Conversions: The number of additional conversions driven by the ad
- FDR Significance: Indicates whether the lift is statistically reliable
Table View
This is the same table as the previous section, ZIP Classification — Scale / Observe / Ignore / Block. Refer to the above section for detailed column definitions and interpretation.
Top Scale ZIPs — Incremental Conversions
This section highlights ZIPs classified as Scale (high lift, high confidence), ranked by estimated incremental conversions. Error bars show the 90% credible interval from Monte Carlo simulation. These are the proven winners – increase budget here.
Chart View
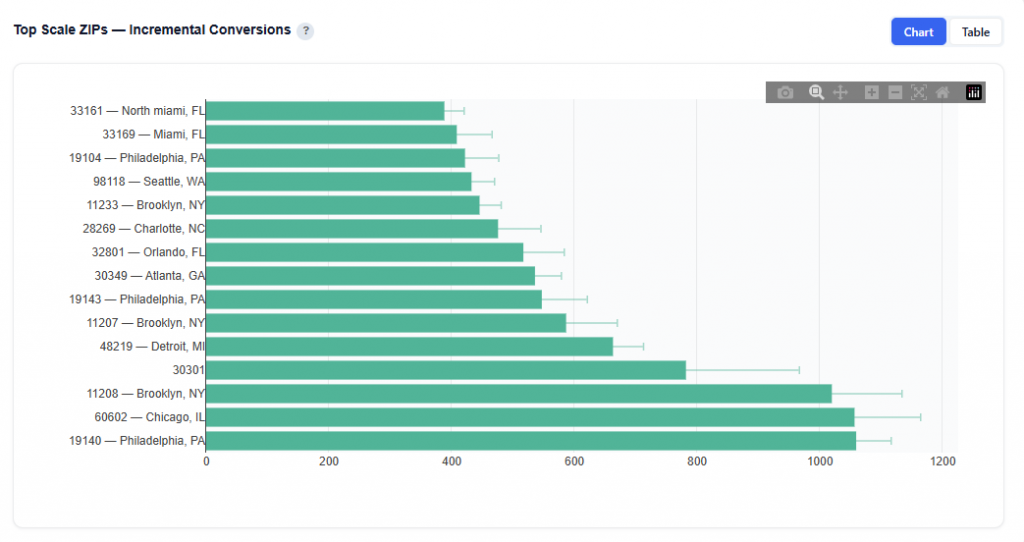
What It Shows:
- Only ZIPs classified as Scale Ranked by incremental conversions (highest at the bottom)
- Bars represent the estimated number of conversions driven by ads
- Error bars show the 90% credible interval from Monte Carlo simulation
- Reflect the range of likely outcomes
- Narrower intervals = more confidence
- Wider intervals = greater uncertainty
- Hover to see the Incremental Conversions
Identify proven high-impact ZIPs backed by statistical confidence.
Table View
This is the same dataset as the ZIP Classification table, filtered to Scale ZIPs only. Refer to the ZIP Classification — Scale / Observe / Ignore / Block section for full column definitions.
Lift Distribution Across ZIPs
This chart shows the distribution of relative lift (%) across all analyzed ZIP codes, helping you understand how incremental performance is spread across your campaign.
Chart View
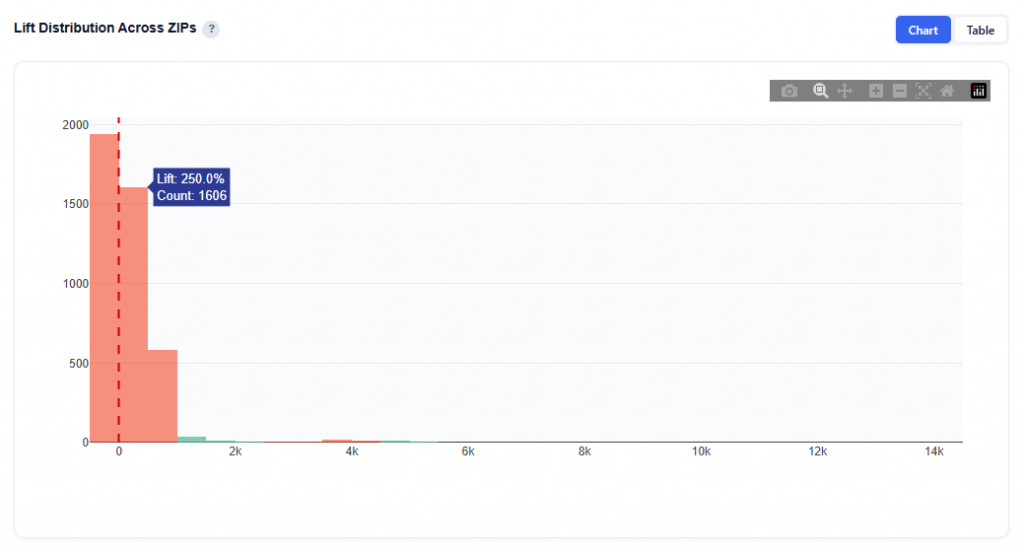
What It Shows:
- Histogram of relative lift (%) for all ZIPs
- Each bar represents the number of ZIPs within a lift range
- The vertical dashed line at 0 represents no incremental impact
Interpretation:
- Right of zero (positive lift): ZIPs where advertising is driving incremental conversions
- Left of zero (negative lift): ZIPs where advertising is not effective or may be harming performance
- Cluster around zero: ZIPs with little to no measurable incremental impact
- Long right tail: A small number of ZIPs driving very high incremental lift
Why It’s Useful:
- Shows whether performance is broadly distributed or concentrated
- Helps assess overall campaign effectiveness
- Identifies if results are driven by:
- Many moderately positive ZIPs
- Or a few high-impact outliers
Table View
This is the same dataset as the ZIP Classification table. Refer to the ZIP Classification — Scale / Observe / Ignore / Block section for full column definitions.
Exposed vs Control — Conversion Rate by ZIP
This chart compares conversion rates between users who saw ads (exposed) and those who did not (control) across each ZIP code, showing where advertising is driving true incremental impact.
Chart View
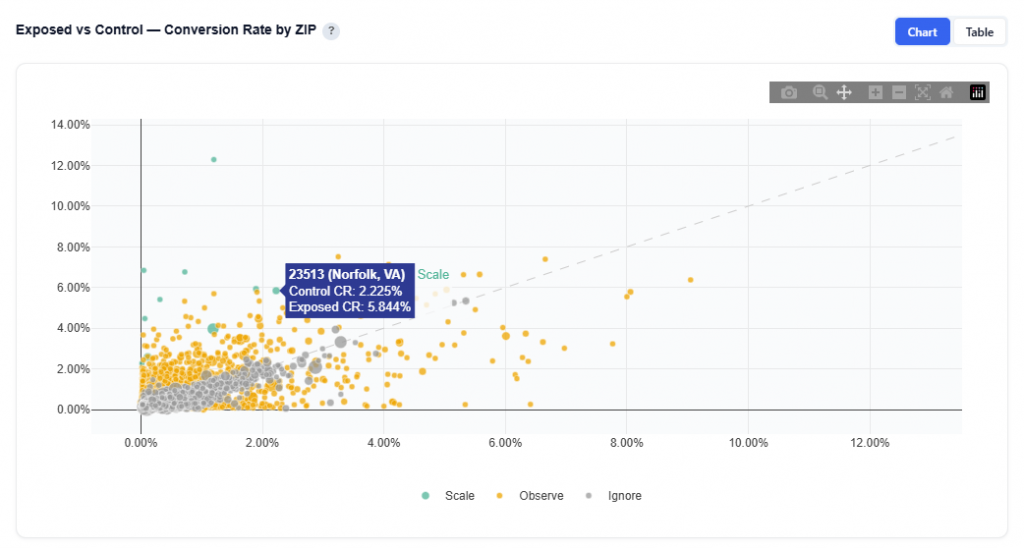
What It Shows:
- Each do represents a ZIP code
- X-axis (Control CR): Conversion rate of users who were eligible but not served ads (baseline)
- Y-axis (Exposed CR): Conversion rate of users who were served ads
- The diagonal line represents equal performance between exposed and control
Interpretation:
- Above the diagonal: Exposed CR > Control CR and ads are driving incremental conversions
- Below the diagonal: Exposed CR < Control CR and ads may be ineffective or counterproductive
- Near the line: Minimal difference and/or little to no measurable incremental impact
- Farther from the line: Greater difference and stronger positive or negative impact
Table View
This is the same dataset as the ZIP Classification table. Refer to the ZIP Classification — Scale / Observe / Ignore / Block section for full column definitions.
Ad Impact by ZIP — Control vs Exposed Conversion Rate
This chart shows the direct impact of advertising at the ZIP level by comparing conversion rates between control (no ads) and exposed (with ads) users and visualizing the lift.
Chart View
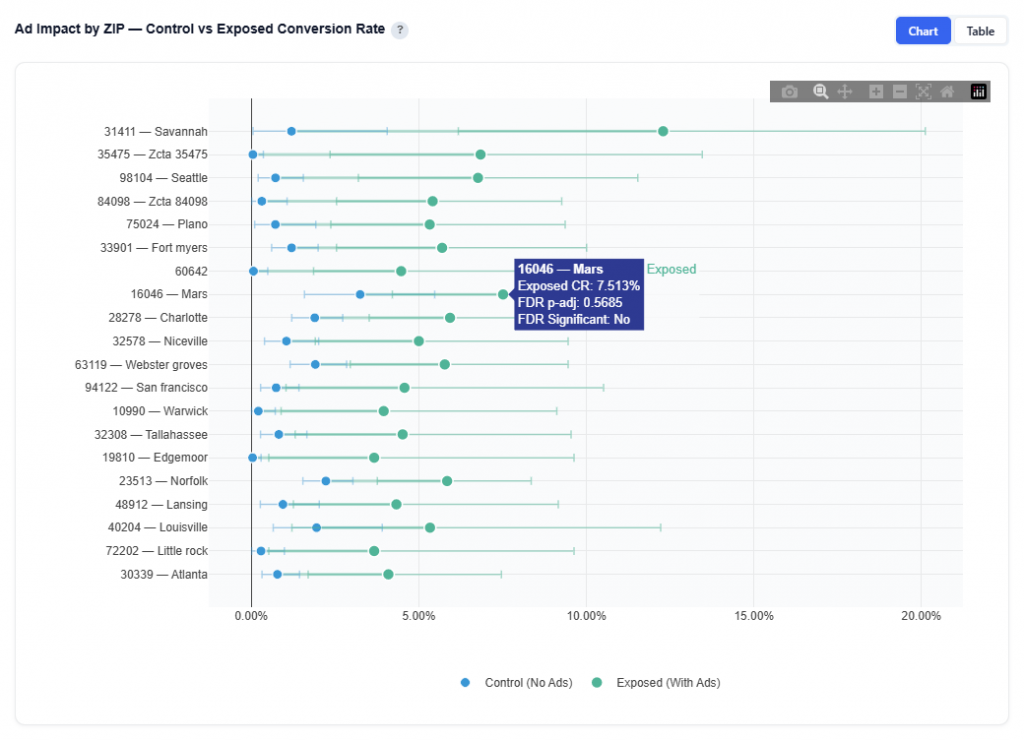
What It Shows:
- Each row represents a ZIP code
- Blue dot: Control conversion rate (baseline, no ads)
- Green dot: Exposed conversion rate (with ads)
- The line connecting the dots represents the incremental lift
- Longer lines = larger impact
- Whiskers on each dot show the 95% credible intervals
Hover Data:
- ZIP Code and name
- Conversion Rate
- FDR-adjusted p-value: Indicates statistical confidence after correcting for multiple comparisons
- Lower values = higher confidence
- Helps confirm whether observed lift is reliable
Table View
This is the same dataset as the ZIP Classification table. Refer to the ZIP Classification — Scale / Observe / Ignore / Block section for full column definitions.
Explorer
The Explorer tab allows you to browse and interact with all available datasets used in the model. Select a dataset to view its chart and table. Use the metric buttons above charts to switch between available metrics.
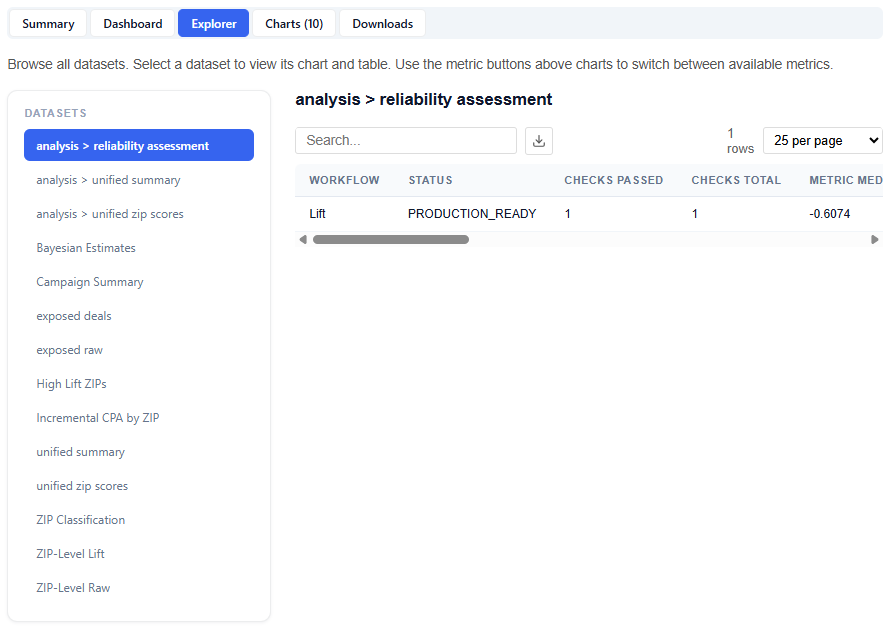
What It Does:
- Lists all datasets in the left-hand panel
- Displays each selection as a chart and table
This section is intentionally extensive and exploratory. Users are encouraged to navigate different datasets and metrics to uncover additional insights.
Charts
The Charts tab provides access to all visualizations generated by the model, organized into categories for easier navigation and analysis.
Charts are grouped into the following sections:
- Decision Support
- Distributions
- Confidence
- Geographic
Downloads
The Downloads section provides full access to all model outputs, enabling deeper analysis, reporting, and sharing across teams. These outputs can be used for investigation and validation, but more importantly, the model can be applied directly to campaigns or line items, allowing insights to seamlessly translate into real-time bidding and optimization.
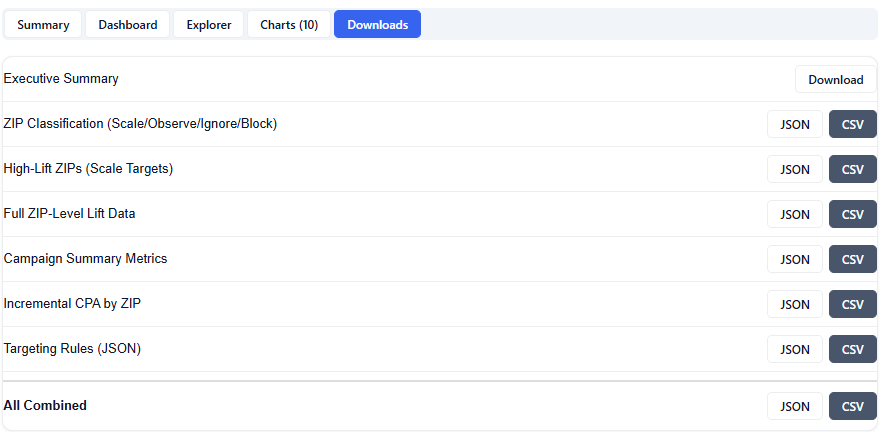
Available Downloads (JSON & CSV):
- Executive Summary: High-level summary of findings, insights, and key drivers
- ZIP Classification (Scale/Observe/Ignore/Block)
- High-Lift ZIPs (Scale Targets)
- Full ZIP-Level Lift Data
- Campaign Summary Metrics
- Incremental CPA by ZIP
- Targeting Rules (JSON)
- All Combined