The Incrementality report measures the true impact of advertising by comparing users who were exposed to ads against a matched control group who were not.
It identifies what actually works by removing organic conversions and calculating incremental lift, then uses these results to train a model that classifies ZIP codes based on incremental performance.
This model segments markets into actionable groups (e.g., Scale, Observe, Ignore), enabling direct application to targeting and real-time bidding strategies.
Use Case Examples
Understand the True Impact of Your Campaigns
Measure the incremental lift driven by your campaigns—so you can separate what your media is actually contributing from what could have happened anyway.
Prove the Value of Your Media Investment
Quantify how much of your performance is driven by advertising—so you can demonstrate CPA, ROI, and justify spend with confidence.
Optimize Budget and Reduce Waste with Incrementality Insights
Identify which campaigns, audiences, or strategies are truly driving incremental results—so you can shift budget toward what delivers real impact.
Identify underperforming or non-incremental ZIP codes and segments to further investigate—so you can refine messaging, creative, and targeting to improve efficiency and drive greater incremental lift.
Test and Validate Your Strategy
Evaluate different targeting strategies, creatives, or channels to understand what actually drives lift—so you can make smarter, data-backed decisions moving forward.
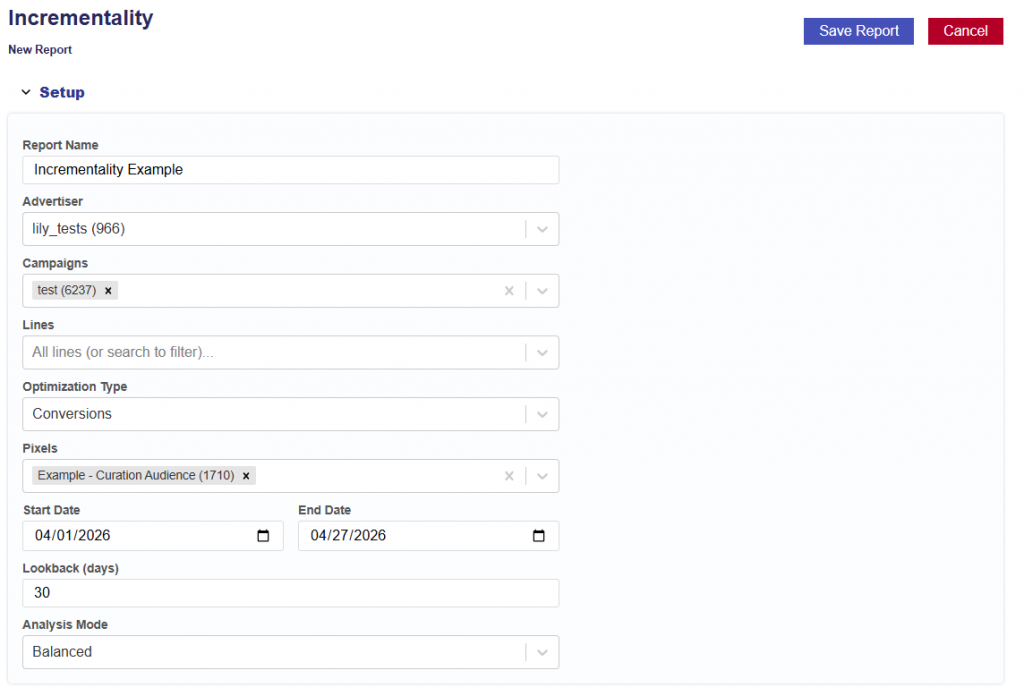
New Report Set Up
Choose how you want to analyze campaign impact, then configure campaign inputs, dates, and optimization settings to generate the report results and incremental model.
Instructions for generating a Incrementality Report and Model. Follow the steps for initial setup below:
Navigate to the Incrementality Tab
Click the New Report button
Give the report a name
Select the Advertiser to run the analysis on
Select the Campaign(s) within the chosen Advertiser.
If no campaigns are selected, all campaigns will be included.
Select the Line(s) within the chosen Campaign(s).
If no lines are selected, all lines will be included.
Optimization Type:
Conversions: Choose the conversion pixel to be used for optimization.
Select the analysis Start Date.
Select the analysis End Date.
Enter the desired lookback window (in days).
Default is 30 days.
This defines how far back the model will attribute conversions or clicks to ad exposure.
Select the Analysis Mode:
Fast: Runs quickly using a smaller sample size for directional insights with lower statistical confidence.
Balanced: Provides a balance between speed and statistical reliability, suitable for most analyses.
Thorough: Uses the largest sample and most rigorous evaluation for maximum accuracy and highest statistical confidence.
Choose whether the report should run once or repeat on a schedule.
Run once builds a single report.
Schedule re-runs it on the chosen cadence — each run retrains the model, replaces the live model in S3 when Replace the live model each run is enabled, and is saved as a new run grouped under this report.
Rerun Interval:
Weekly
Every 2 Weeks
Monthly
Rerun Day of Week:
Monday
Tuesday
Wednesday
Thursday
Friday
Saturday
Sunday
Replace the live model each run checkbox
On: each run’s new model overwrites the live model so it goes live automatically.
Off: runs still produce reports and archived models, but the live model is left untouched.
Click the Save Report button.
Key Notes:
Requires campaign delivery and pixel fires to measure incrementality
Uses exposed vs. control methodology to train a model that classifies ZIP-level performance
Outputs are directly usable for targeting, budget allocation, and real-time bidding strategies
Report Results
The Incrementality Reports results include the pipeline used, date created, when the report started, and when the reported completed. The output is separated into 5 sections:
Summary
Dashboard
Explorer
Charts
Downloads
This information provides a complete audit trail and transparency into the model, allowing users to understand how results are generated and directly tie insights back to campaign performance, rather than relying on a black-box approach.
Summary
The Summary section provides a high-level overview of the analysis, including the Report ID, Advertiser ID, and Date Range, along with an automatically generated Executive Summary. The Executive Summary explains what is driving incremental performance and highlights where advertising is creating true lift, helping inform optimization decisions using model-based predictions.
Tip: You can input the Executive Summary into your preferred LLM (e.g., ChatGPT or Claude) to quickly generate a presentation deck or case study based on the results.
Dashboard
The Dashboard provides a visual overview of incremental lift and true campaign impact, comparing exposed users (who saw ads) against a matched control group (who did not).
Exposed Group: Unique IPs served ads, matched to pixel fires where the ad was shown before conversion within the lookback window
Control Group: 1% random sample of bid stream IPs in the same ZIPs and deal IDs, not served ads, matched to the same pixel fires
ZIP codes are filtered to within 1 standard deviation of mean impression volume to ensure reliable comparisons.
The model classifies ZIPs into:
Scale: Strong positive lift with high confidence
Observe: Moderate or emerging signal
Ignore: No measurable incremental impact
Block: Negative lift
Dashboard Sections:
Tile Metrics
ZIP Classification — Scale / Observe / Ignore / Block
Geographic Analysis
Top Scale ZIPs — Incremental Conversions
Lift Distribution Across ZIPs
Exposed vs Control — Conversion Rate by ZIP
Ad Impact by ZIP — Control vs Exposed Conversion Rate
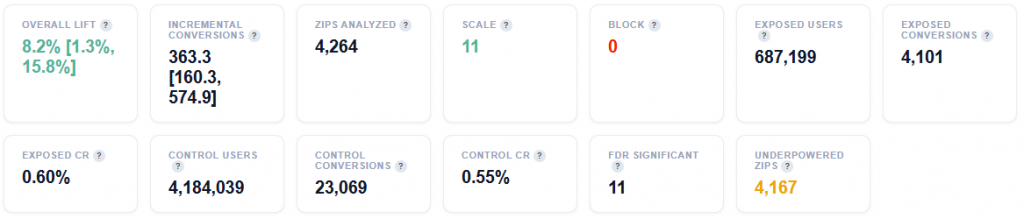
Tile Metrics
Overall Lift: Percentage increase in conversion rate for users who saw ads versus those who did not. Positive = ads are driving incremental impact. Range in brackets is the 95% bootstrap confidence interval.
Incremental Conversions: Estimated conversions that would NOT have happened without advertising. Range in brackets is the 95% bootstrap confidence interval.
ZIPs Analyzed: ZIP codes with impression volume within 1 standard deviation of the mean – statistically meaningful sample sizes.
Scale: ZIPs with high positive lift and high confidence – increase budget here.
Block: ZIPs with negative or zero lift – ads are not working here, stop spending.
Exposed Users: Unique IPs served ads by this campaign.
Exposed Conversions: Unique exposed IPs that fired the pixel AFTER being served an ad (within lookback window). Matched via pixel server logs.
Exposed CR: Conversion rate for the exposed group (Exposed Conversions / Exposed Users).
Control Users: Unique IPs from 1% sample bid steam in the same ZIPs and deal IDs, NOT served ads by this campaign.
Control Conversions: Unique control IPs that fired the pixel AFTER their sample request (within lookback window). Same pixel server log source as exposed – apples to apples comparison.
Control CR: Conversion rate for the control group (Control Conversions / Control Users). This is the baseline organic conversion rate.
FDR Significant: ZIPs that pass Benjamini-Hochberg FDR correction at 10% – these lift estimates are statistically reliable after correcting for multiple comparisons.
Underpowered ZIPs: ZIPs where sample size is too small to detect the observed lift reliably (lift < minimum detectable effect). These are classified as Observe regardless of lift magnitude.
Incremental CPA: True cost per conversion caused by advertising: (Spend / Incremental Conversions. This is the honest acquisition cost – excludes conversions that may have happened anyway.
Standard CPA: Traditional cost per conversion: (Spend / All Conversions). Lower than incremental CPA because it counts conversions that would have happened possibly without ads.
CPA Inflation: How much higher the true (incremental) CPA is vs standard CPA. A factor of 2x means that the real cost of acquiring a customer is twice what standard reporting suggests.
Total Spend: The total media spend across al ZIPs (full volume, no down sampling).
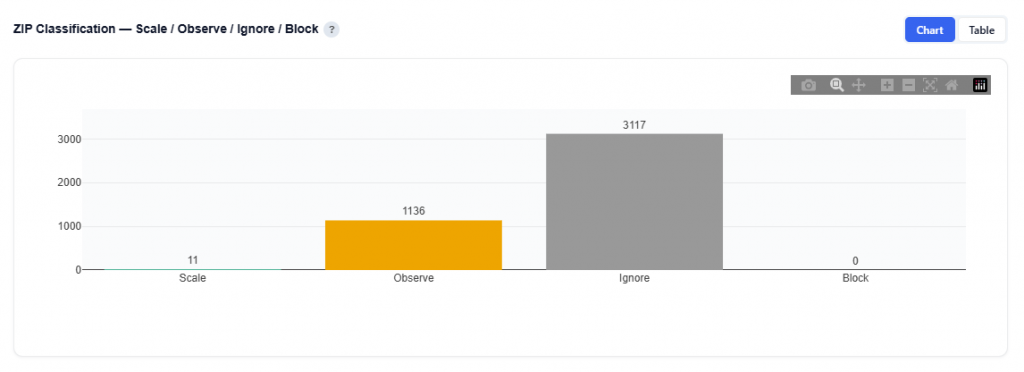
ZIP Classification — Scale / Observe / Ignore / Block
This section categorizes ZIP codes based on incremental lift and statistical confidence, helping identify where advertising is driving real impact and where it is not. Each ZIP is classified based on its lift magnitude, statistical confidence, and sample quality. Scale indicates high lift with strong confidence, while Block reflects negative lift or no measurable effect.
Chart View
What It Shows
Each ZIP is classified into one of four groups based on:
Lift magnitude (positive or negative impact)
Statistical confidence (reliability of the result)
Classification Definitions
Scale: ZIPs with strong positive lift and high statistical confidence
Proven to drive incremental conversions
Best candidates for increased budget and expansion
Observe: ZIPs with moderate or emerging signals
Potential to perform well but require more data
Suitable for continued testing and monitoring
Ignore: ZIPs with no measurable incremental impact
Conversions likely occurring organically
Candidates for reduced spend or deprioritize
Block: ZIPs with negative lift
Advertising may be harming performance
Should be excluded from targeting
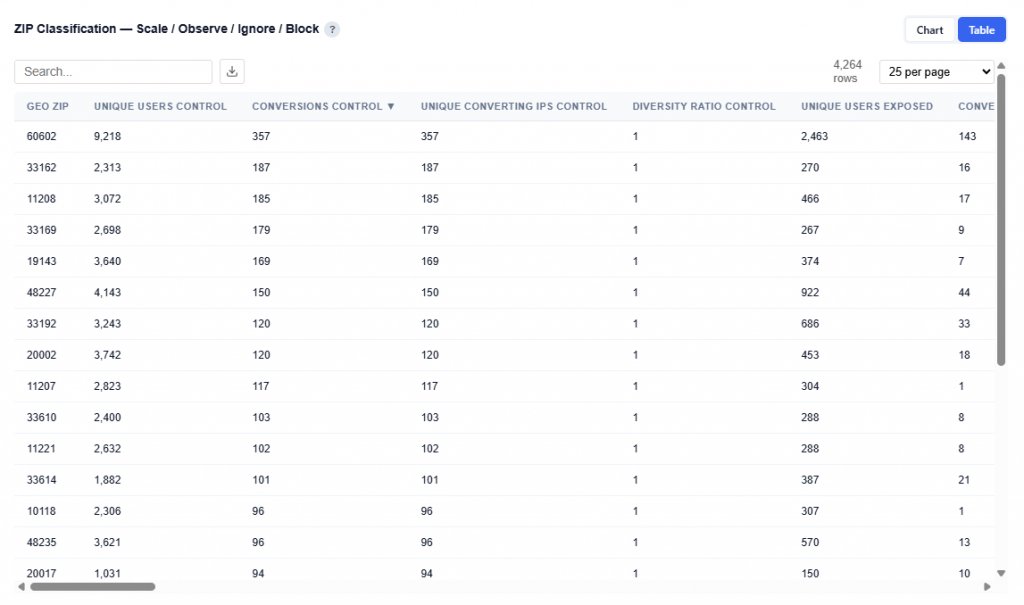
Table View
This table provides the full ZIP-level output of the incrementality model, combining exposure data, lift measurement, statistical confidence, and cost efficiency. Users can download this table as a CSV file for further analysis.
Columns:
Geo ZIP: ZIP code being evaluated
Unique Users Control: Number of users not served ads
Conversions Control: Total conversions from control group
Unique Converting IPs Control: Unique converters in control group
Diversity Ratio Control: Distribution of conversions across users in control group
Unique Users Exposed: Number of users served ads
Conversions Exposed: Total conversions from exposed users
Unique Converting IPs Exposed: Unique converters in exposed group
Diversity Ratio Exposed: Distribution of conversions across users in exposed group
CR Control Raw: Raw conversion rate for control group
CR Exposed Raw: Raw conversion rate for exposed users
Raw Lift: Difference between exposed and control conversion rates
Diversity Valid Exposed: Whether exposed data passes diversity validation checks
Diversity Confidence: Confidence in diversity-based data reliability
CR Control Bayes: Bayesian-adjusted conversion rate for control group
CR Exposed Bayes: Bayesian-adjusted conversion rate for exposed users
CR Control CI Low: Lower bound of control conversion rate confidence interval
CR Control CI High: Upper bound of control conversion rate confidence interval
CR Exposed CI Low: Lower bound of exposed conversion rate confidence interval
CR Exposed CI High: Upper bound of exposed conversion rate confidence interval
Incremental Conversions: Estimated conversions driven by advertising
Lift Confidence: Confidence level of the lift estimate
Relative Lift: Percent increase in conversion rate vs control
Probability Positive: Probability that lift is positive
Probability Large Positive: Probability of strong positive lift
Probability Negative: Probability that lift is negative
Expected Lift: Average expected lift value
Lift Std: Standard deviation of lift
Lift 5th Percentile: Lower bound of lift estimate range
Lift 95th Percentile: Upper bound of lift estimate range
Expected Value: Expected economic value generated by lift
Value Std: Standard deviation of expected value
Probability Profitable: Probability that the ZIP is profitable
Value 5th Percentile: Lower bound of expected value
Value 95th Percentile: Upper bound of expected value
Sample Adequacy Score: Score indicating if sample size is sufficient
Incremental Conv CI Low: Lower bound of incremental conversions
Incremental Conv CI High: Upper bound of incremental conversions
Classification: Final label (Scale, Observe, Ignore, Block)
P Adjusted: P-value adjusted for multiple comparisons
FDR Significant: Whether result is statistically significant after correction
Min Detectable Lift: Minimum lift detectable with current sample size
Lift vs Avg: Lift relative to campaign average
Unique IPs: Total unique users observed
Score: Model-derived ranking score for prioritization
City: City name
State ID: State abbreviation
Total Spend: Total spend in the ZIP
CPM: Cost per thousand impressions
Total Impressions: Total impressions served
Incremental CPA: Cost per incremental conversion
Standard CPA: Traditional cost per conversion
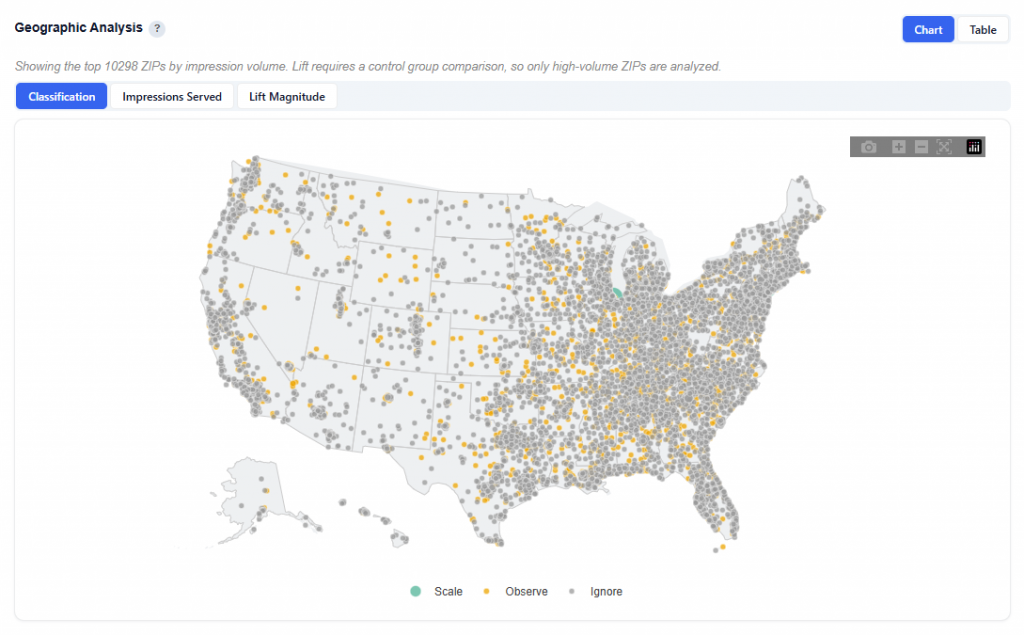
Geographic Analysis
This section visualizes ZIP-level performance, showing how incremental impact varies across locations.
Each dot represents an analyzed ZIP code, allowing you to quickly identify where advertising is working and where it is not.
Toggle Views:
Classification: Colors ZIPs by Scale, Observe, Ignore, Block
Quickly identify high- and low-performing markets
Impressions Served: Dot size represents user volume / impressions
Larger dots = more reach and spend
Lift Magnitude: Color represents direction and strength of lift
Green lift (positive) = stronger incremental impact
Red lift (negative) = underperformance
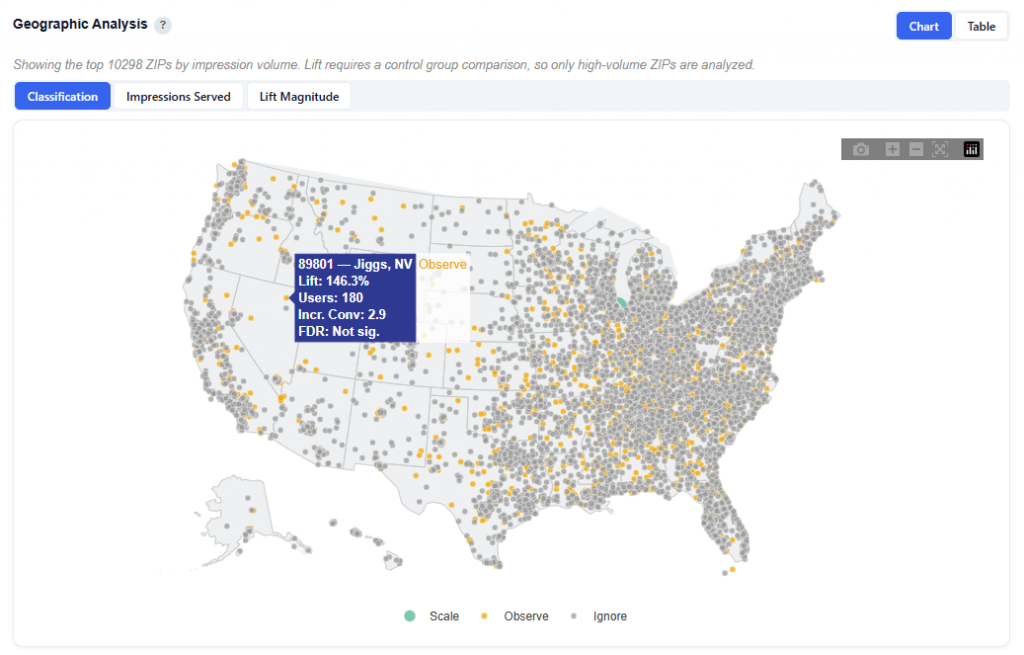
Classification
What It Shows:
Quickly identify where to scale (Scale) and where to monitor (Observe and Ignore)
Look for clusters of Scale ZIPs to find high-performing regions
Use alongside other views to understand both performance and scale
Hover Data:
ZIP code, name and state
Lift: Lift relative to the analysis’s average
Users: Unique users exposed to in that ZIP
Incremental Conversions: The number of additional conversions driven by the ad
FDR Significance: Indicates whether the lift is statistically reliable
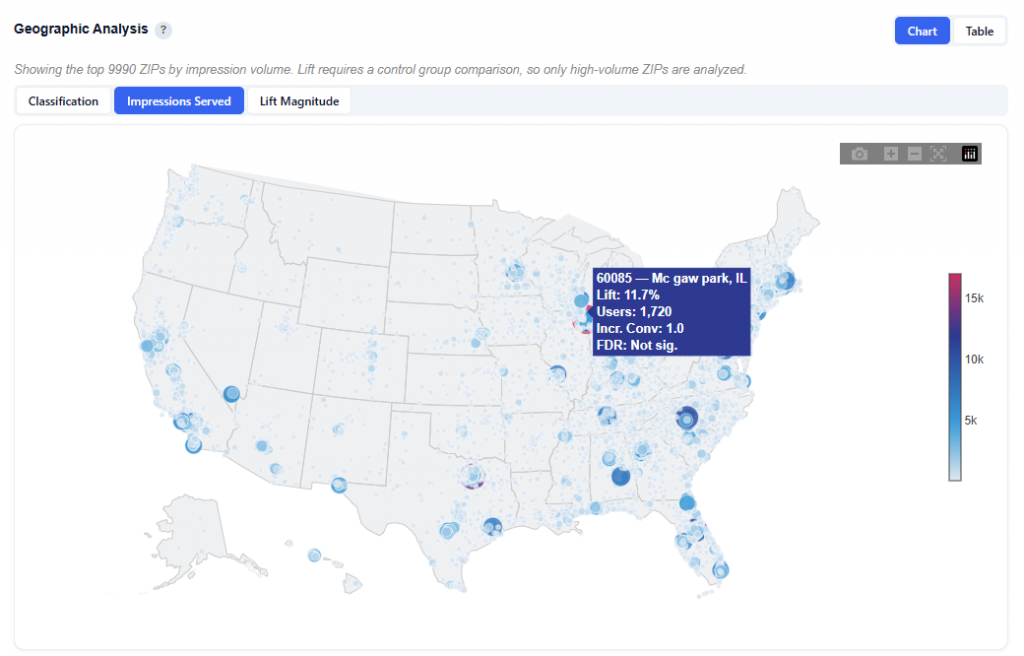
Impressions Served
What It Shows:
Dot size represents impressions served
Color scale reflects Lift vs. Average intensity:
Light blue = below average / negative lift
Red = above average / positive lift
Hover Data:
ZIP code, name and state
Lift: Lift relative to the analysis’s average
Users: Unique users exposed to in that ZIP
Incremental Conversions: The number of additional conversions driven by the ad
FDR Significance: Indicates whether the lift is statistically reliable
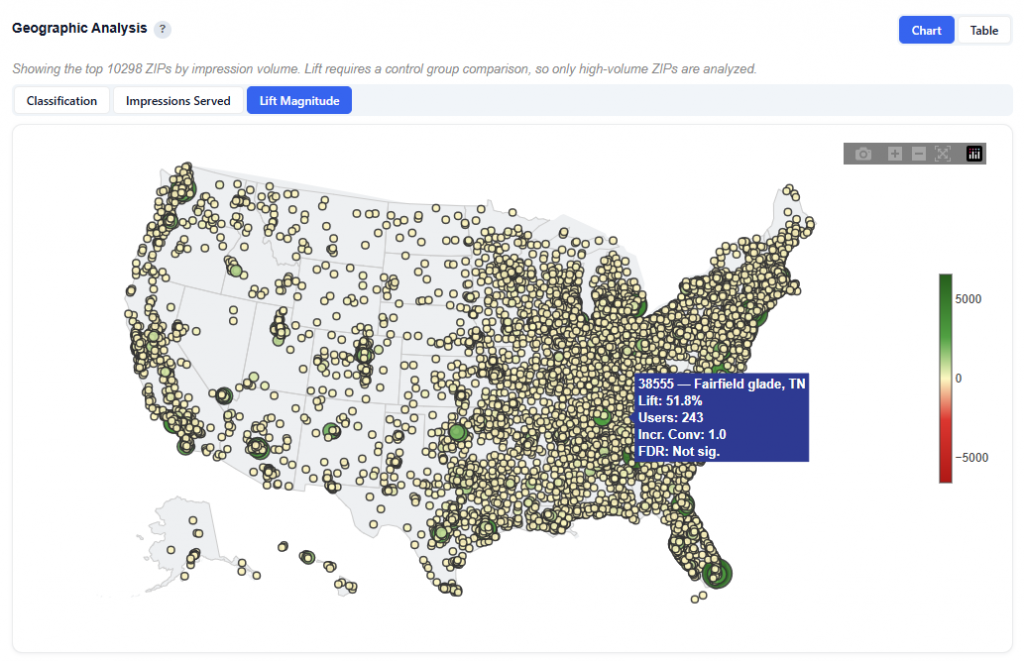
Lift Magnitude
What It Shows:
Color represents direction and strength of lift
Green (Positive) lift = ads are driving incremental conversions
Red (Negative) lift = ads are underperforming
Hover Data:
ZIP code, name and state
Lift: Lift relative to the analysis’s average
Users: Unique users exposed to in that ZIP
Incremental Conversions: The number of additional conversions driven by the ad
FDR Significance: Indicates whether the lift is statistically reliable
Table View
This is the same table as the previous section, ZIP Classification — Scale / Observe / Ignore / Block. Refer to the above section for detailed column definitions and interpretation.
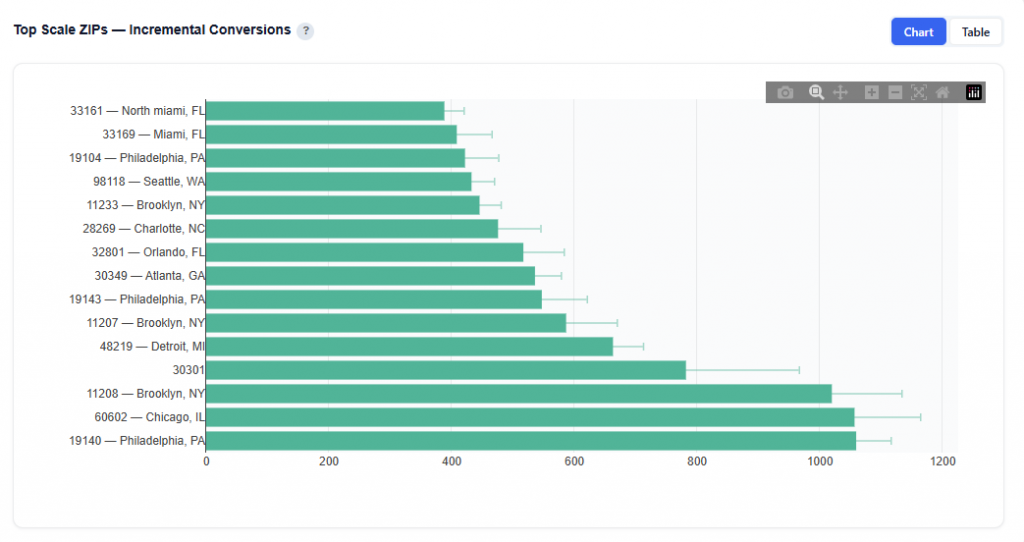
Top Scale ZIPs — Incremental Conversions
This section highlights ZIPs classified as Scale (high lift, high confidence), ranked by estimated incremental conversions. Error bars show the 90% credible interval from Monte Carlo simulation. These are the proven winners – increase budget here.
Chart View
What It Shows:
Only ZIPs classified as Scale Ranked by incremental conversions (highest at the bottom)
Bars represent the estimated number of conversions driven by ads
Error bars show the 90% credible interval from Monte Carlo simulation
Reflect the range of likely outcomes
Narrower intervals = more confidence
Wider intervals = greater uncertainty
Hover to see the Incremental Conversions
Identify proven high-impact ZIPs backed by statistical confidence.
Table View
This is the same dataset as the ZIP Classification table, filtered to Scale ZIPs only. Refer to the ZIP Classification — Scale / Observe / Ignore / Block section for full column definitions.
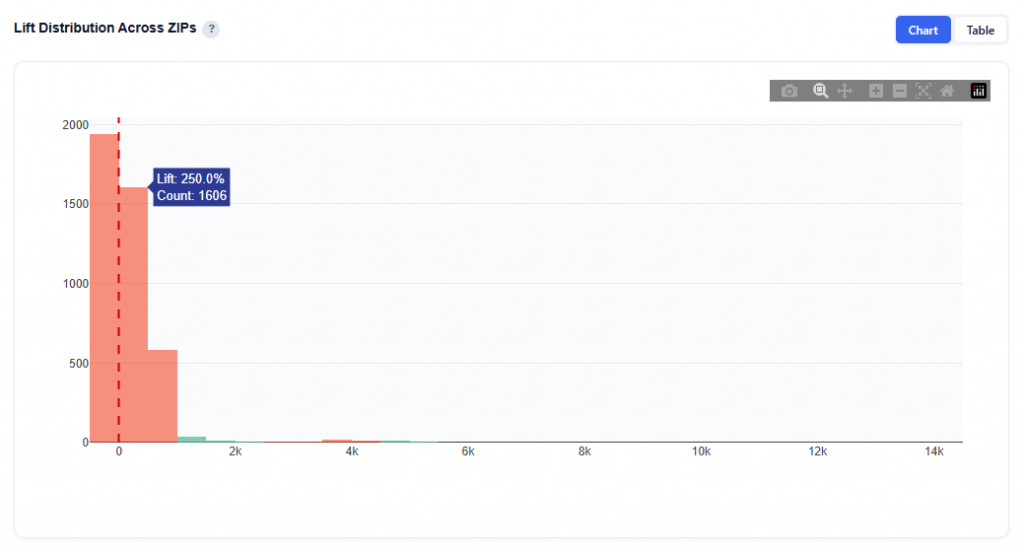
Lift Distribution Across ZIPs
This chart shows the distribution of relative lift (%) across all analyzed ZIP codes, helping you understand how incremental performance is spread across your campaign.
Chart View
What It Shows:
Histogram of relative lift (%) for all ZIPs
Each bar represents the number of ZIPs within a lift range
The vertical dashed line at 0 represents no incremental impact
Interpretation:
Right of zero (positive lift): ZIPs where advertising is driving incremental conversions
Left of zero (negative lift): ZIPs where advertising is not effective or may be harming performance
Cluster around zero: ZIPs with little to no measurable incremental impact
Long right tail: A small number of ZIPs driving very high incremental lift
Why It’s Useful:
Shows whether performance is broadly distributed or concentrated
Helps assess overall campaign effectiveness
Identifies if results are driven by:
Many moderately positive ZIPs
Or a few high-impact outliers
Table View
This is the same dataset as the ZIP Classification table. Refer to the ZIP Classification — Scale / Observe / Ignore / Block section for full column definitions.
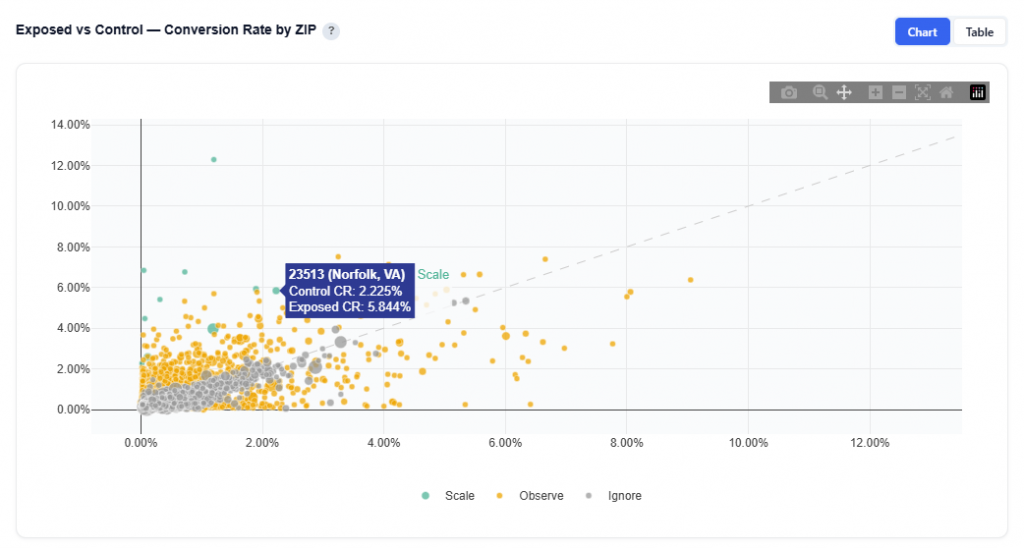
Exposed vs Control — Conversion Rate by ZIP
This chart compares conversion rates between users who saw ads (exposed) and those who did not (control) across each ZIP code, showing where advertising is driving true incremental impact.
Chart View
What It Shows:
Each do represents a ZIP code
X-axis (Control CR): Conversion rate of users who were eligible but not served ads (baseline)
Y-axis (Exposed CR): Conversion rate of users who were served ads
The diagonal line represents equal performance between exposed and control
Interpretation:
Above the diagonal: Exposed CR > Control CR and ads are driving incremental conversions
Below the diagonal: Exposed CR < Control CR and ads may be ineffective or counterproductive
Near the line: Minimal difference and/or little to no measurable incremental impact
Farther from the line: Greater difference and stronger positive or negative impact
Table View
This is the same dataset as the ZIP Classification table. Refer to the ZIP Classification — Scale / Observe / Ignore / Block section for full column definitions.
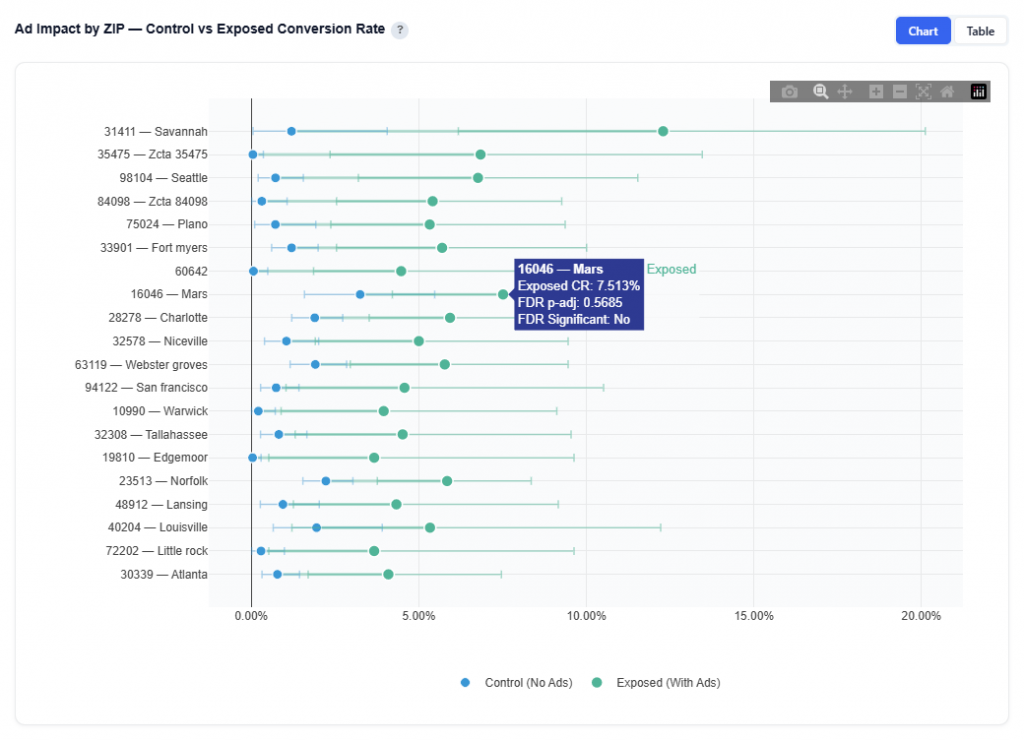
Ad Impact by ZIP — Control vs Exposed Conversion Rate
This chart shows the direct impact of advertising at the ZIP level by comparing conversion rates between control (no ads) and exposed (with ads) users and visualizing the lift.
Chart View
What It Shows:
Each row represents a ZIP code
Blue dot: Control conversion rate (baseline, no ads)
Green dot: Exposed conversion rate (with ads)
The line connecting the dots represents the incremental lift
Longer lines = larger impact
Whiskers on each dot show the 95% credible intervals
Hover Data:
ZIP Code and name
Conversion Rate
FDR-adjusted p-value: Indicates statistical confidence after correcting for multiple comparisons
Lower values = higher confidence
Helps confirm whether observed lift is reliable
Table View
This is the same dataset as the ZIP Classification table. Refer to the ZIP Classification — Scale / Observe / Ignore / Block section for full column definitions.
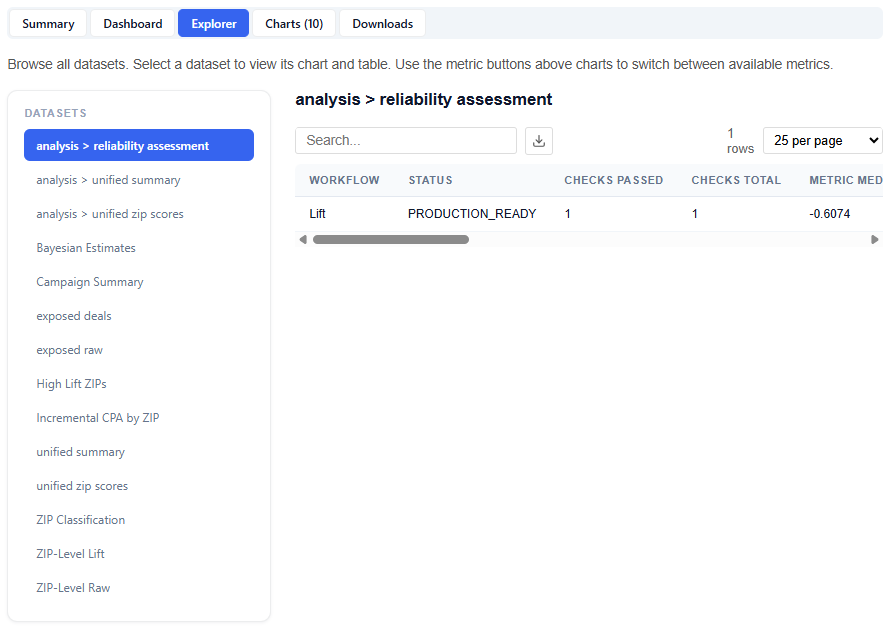
Explorer
The Explorer tab allows you to browse and interact with all available datasets used in the model. Select a dataset to view its chart and table. Use the metric buttons above charts to switch between available metrics.
What It Does:
Lists all datasets in the left-hand panel
Displays each selection as a chart and table
This section is intentionally extensive and exploratory. Users are encouraged to navigate different datasets and metrics to uncover additional insights.
Charts
The Charts tab provides access to all visualizations generated by the model, organized into categories for easier navigation and analysis.
Charts are grouped into the following sections:
Decision Support
Distributions
Confidence
Geographic
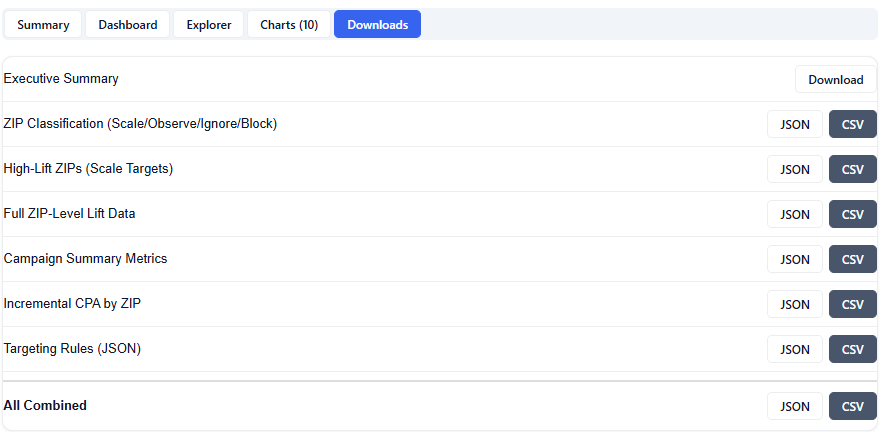
Downloads
The Downloads section provides full access to all model outputs, enabling deeper analysis, reporting, and sharing across teams. These outputs can be used for investigation and validation, but more importantly, the model can be applied directly to campaigns or line items, allowing insights to seamlessly translate into real-time bidding and optimization.
Available Downloads (JSON & CSV):
Executive Summary: High-level summary of findings, insights, and key drivers