What is ART?
Pontiac’s Audience Research Tool (ART) is a comprehensive audience research & design suite that provides custom cookieless targeting for the future of programmatic advertising.
The Cookieless Future and What It Means for Advertisers
As privacy updates push Advertisers into a cookieless world, the era of targeting down to the level of the individual is coming to an end. As the industry moves away from the use of Third-Party Audience Segments, Advertisers are forced to take a fresh look at digital targeting strategies. The key to future success is to find privacy compliant solutions that not only scale, but that continue to drive performance. At Pontiac Intelligence we are focusing on ad personalization through clever geo and inventory-based targeting, with the launch of The Audience Research Tool (ART), an innovative solution that delivers privacy compliant audience insights and targeting strategies.
ART: A Cookie-less Identity Solution
The Audience Research Tool (ART) is a proprietary cookie-less identity solution designed by Pontiac Intelligence to enable Advertisers to both better understand and better reach the users of highest potential value to their brand and subsequently maximize their ad spend.
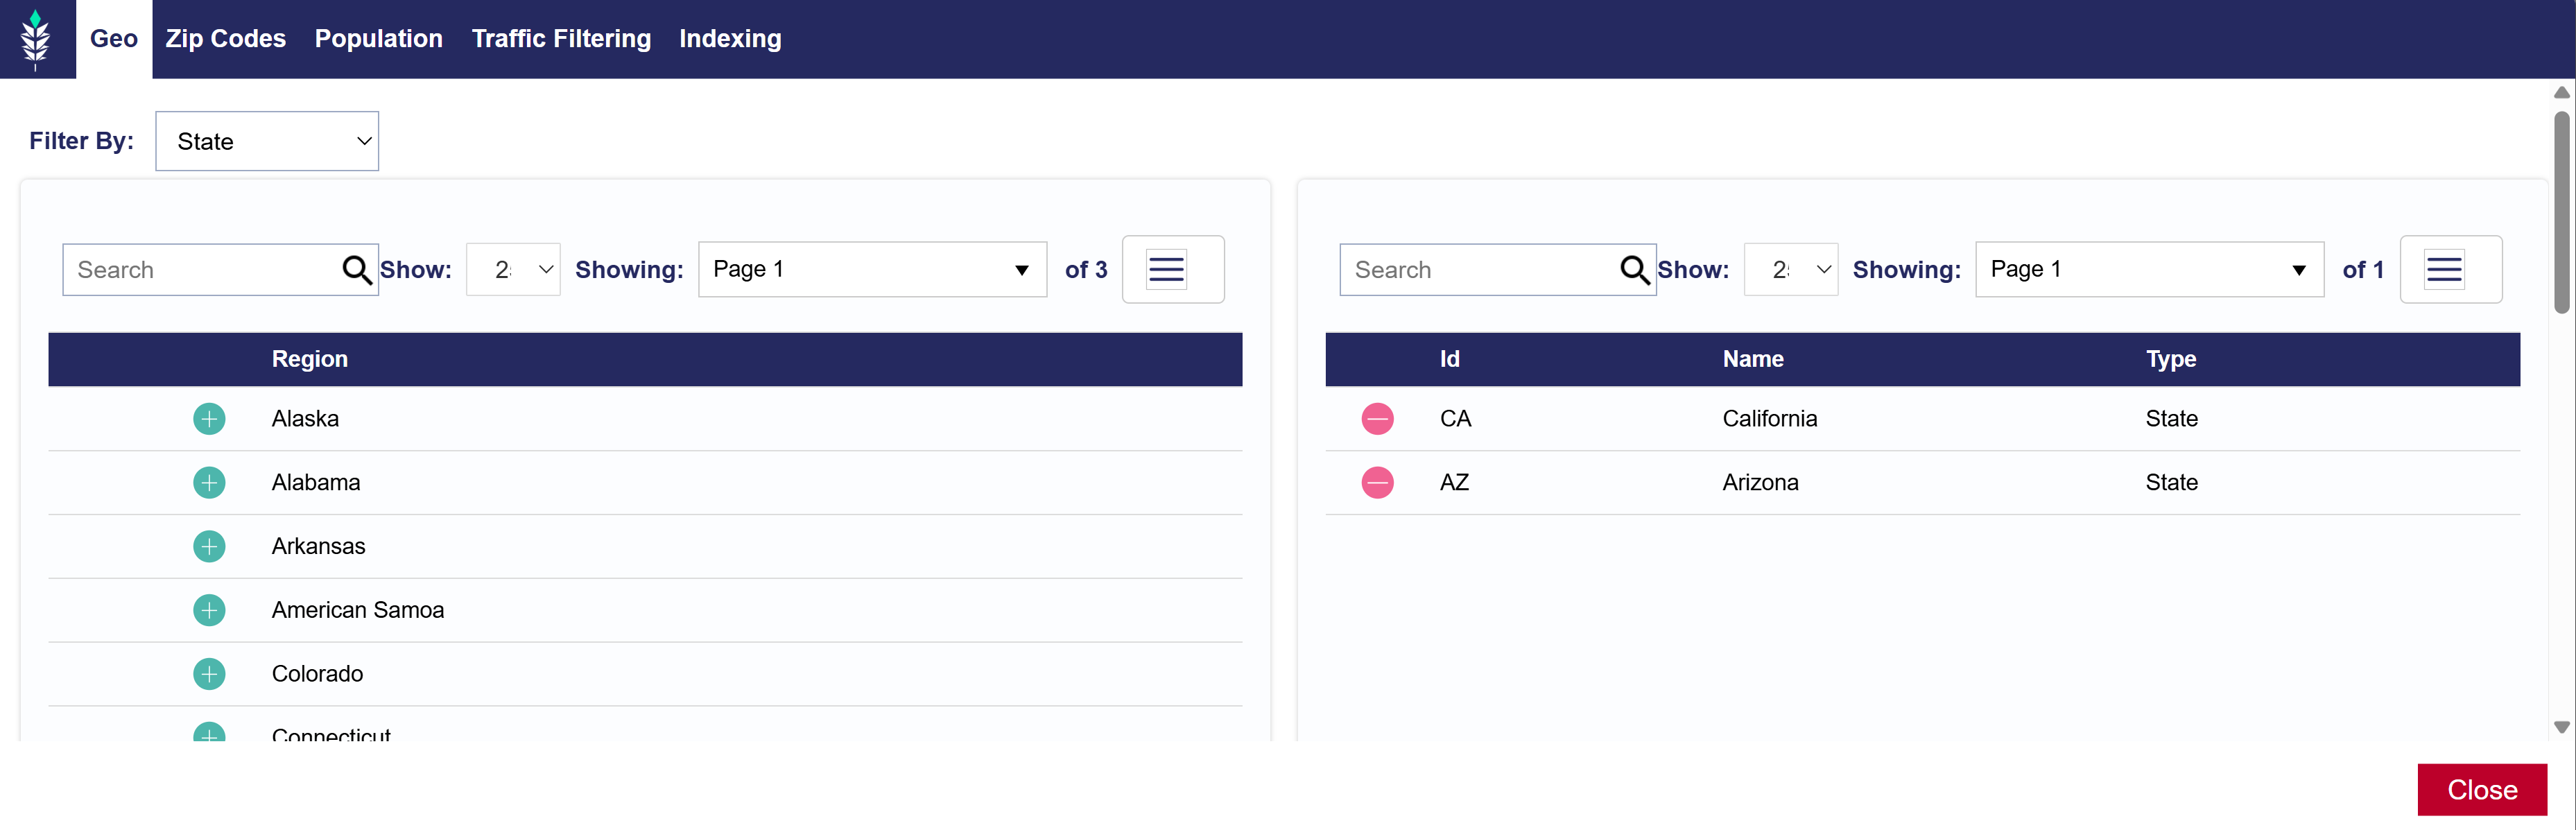
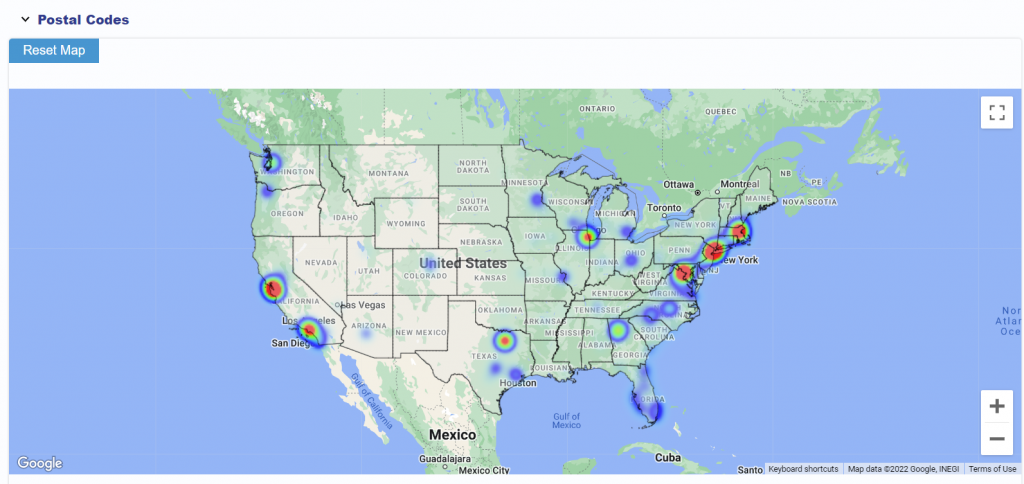
Centered around the U.S. zip code, ART reports aggregate and analyze demographic data & content consumption by zip to build audiences for all channels & media types. A privacy-compliant targeting solution that drives both performance and scale across all your digital campaigns
The power of the ART Platform has the following Tools:
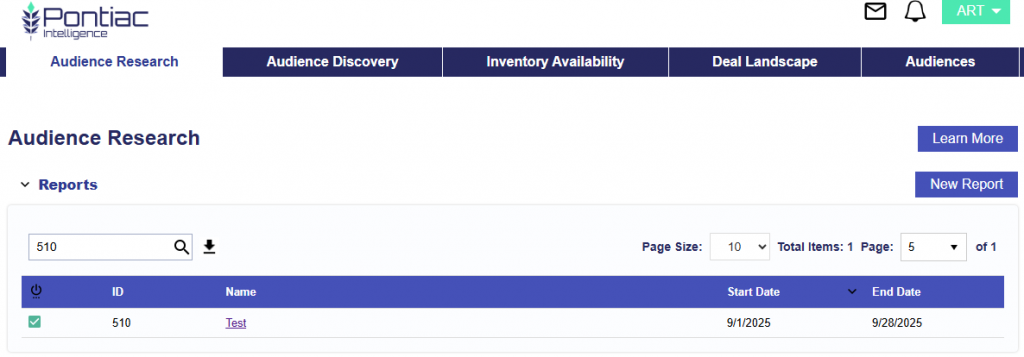
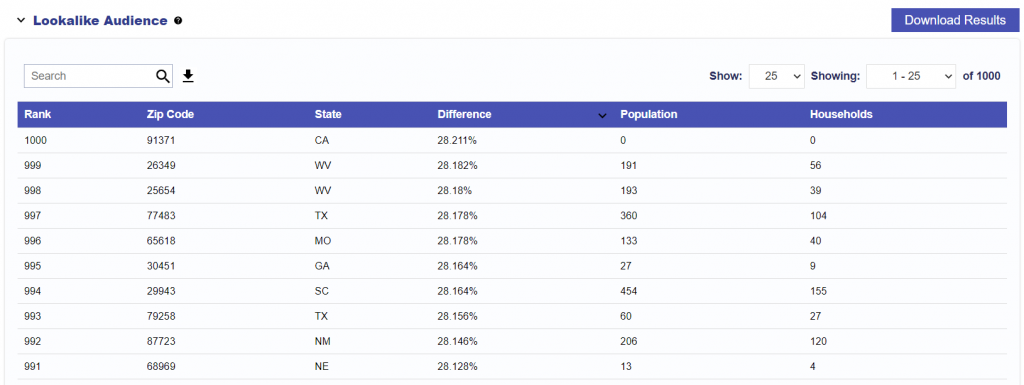
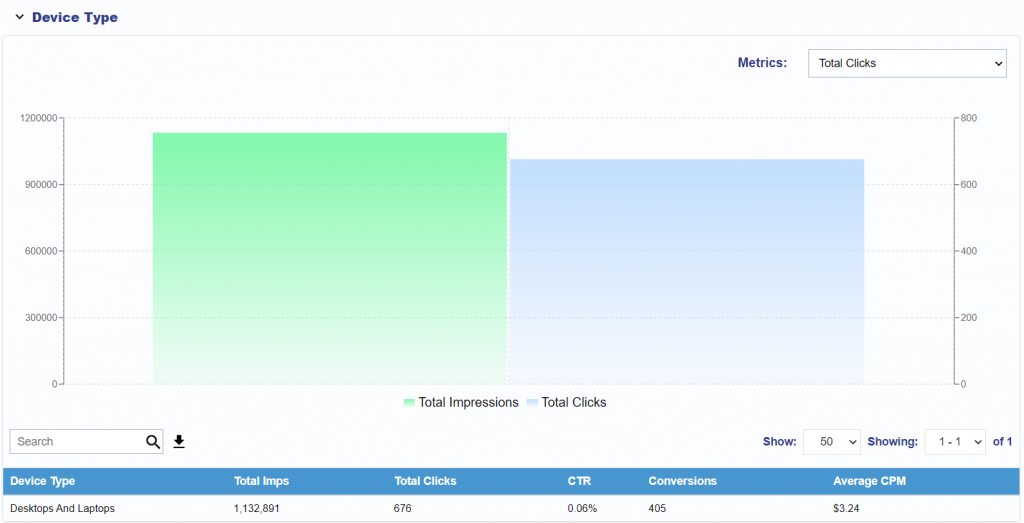
- Audience Research Tool
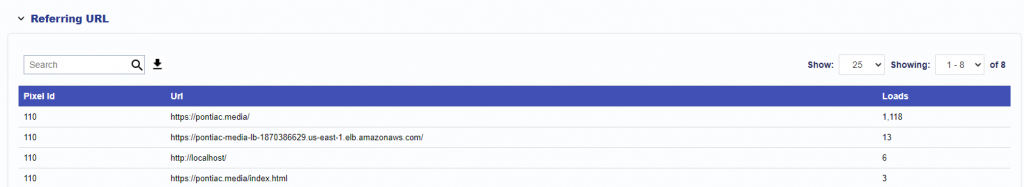
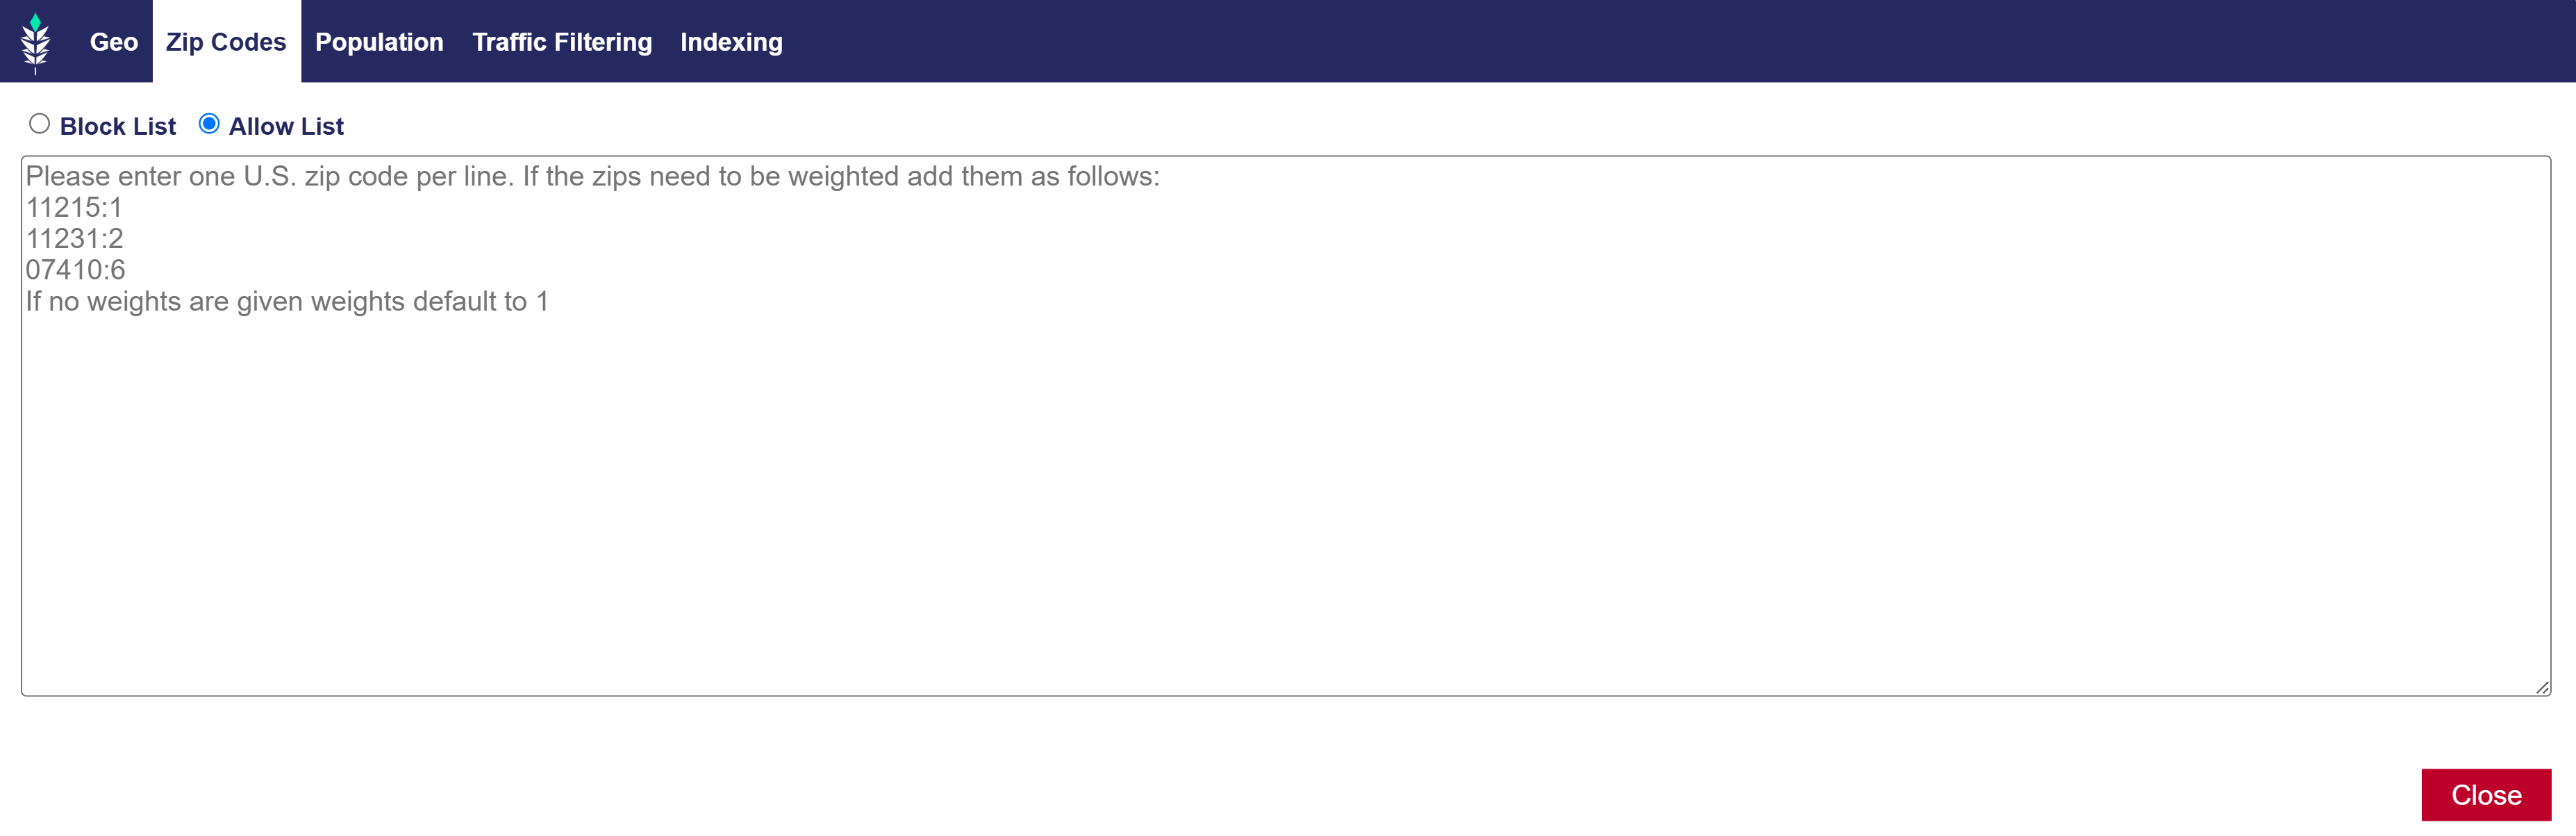
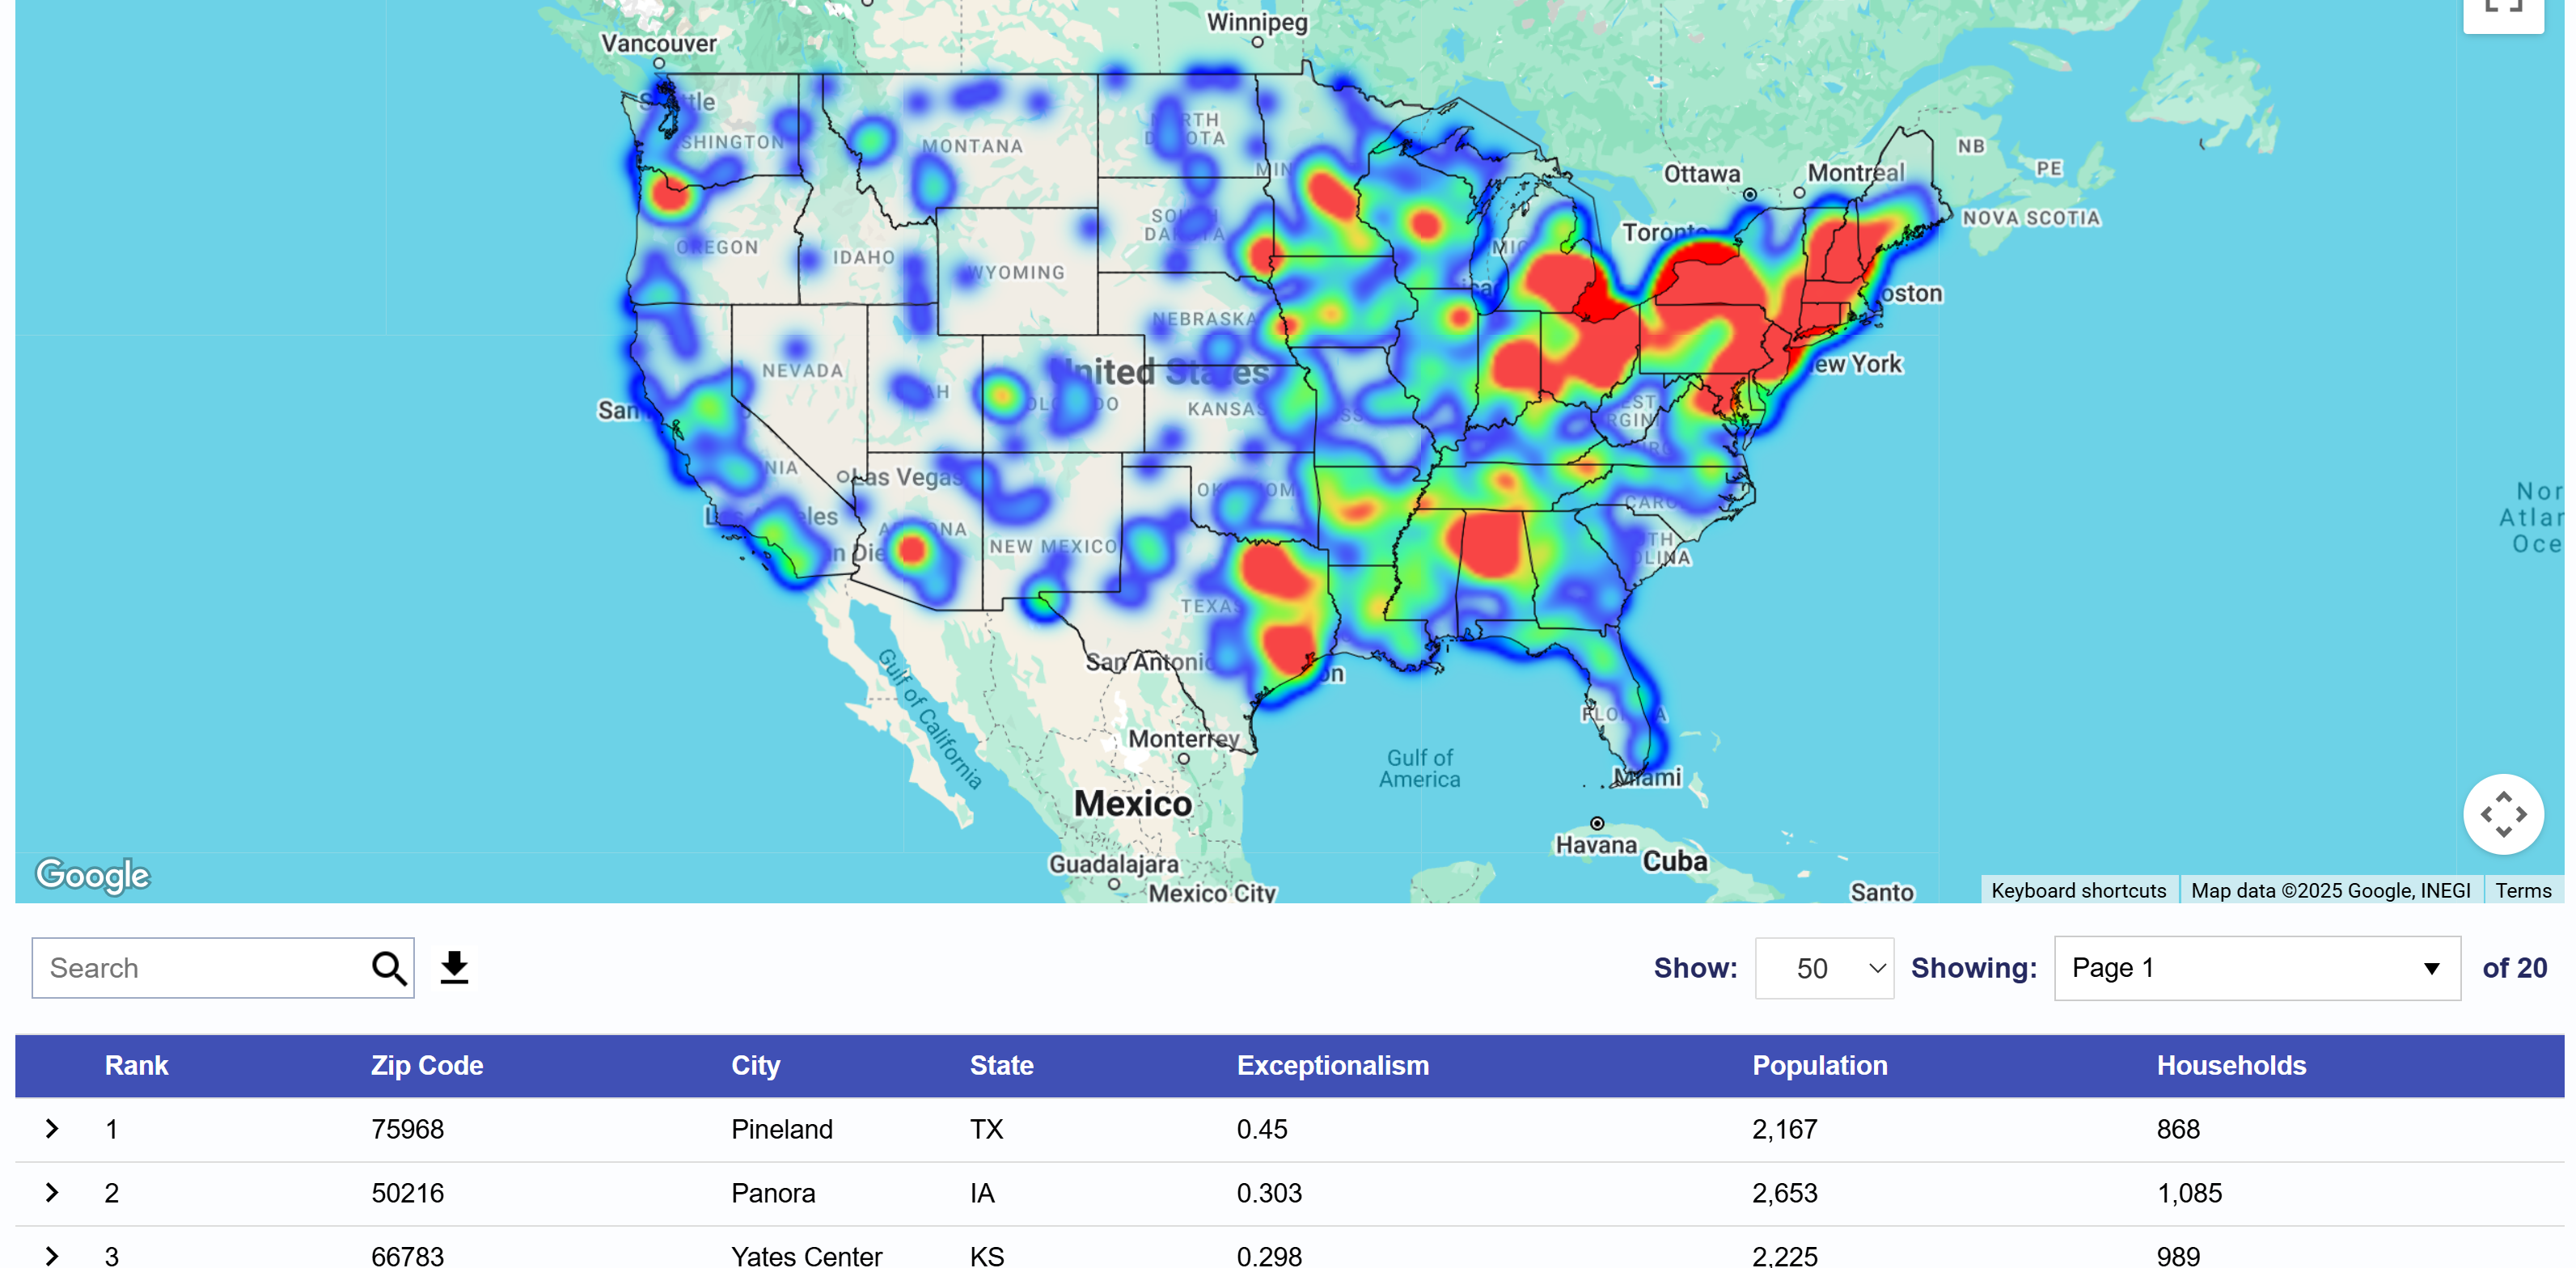
- Locate & understand the highest value users to your brand by utilizing the traffic on your website, or a list of U.S. zip codes, to create detailed insight reports, and leverage look-a-like modeling to find new targets that share key characteristics with your existing audience.
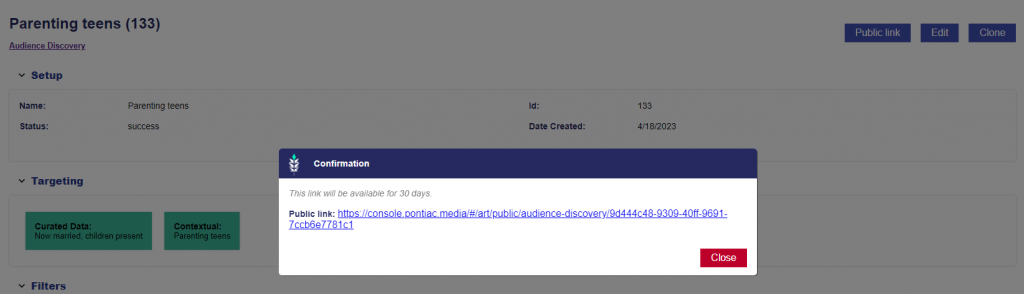
- Audience Discovery Tool
- Select from demographic variables and interest categories to build an audience profile, then find new targets across the U.S. that match this target audience.
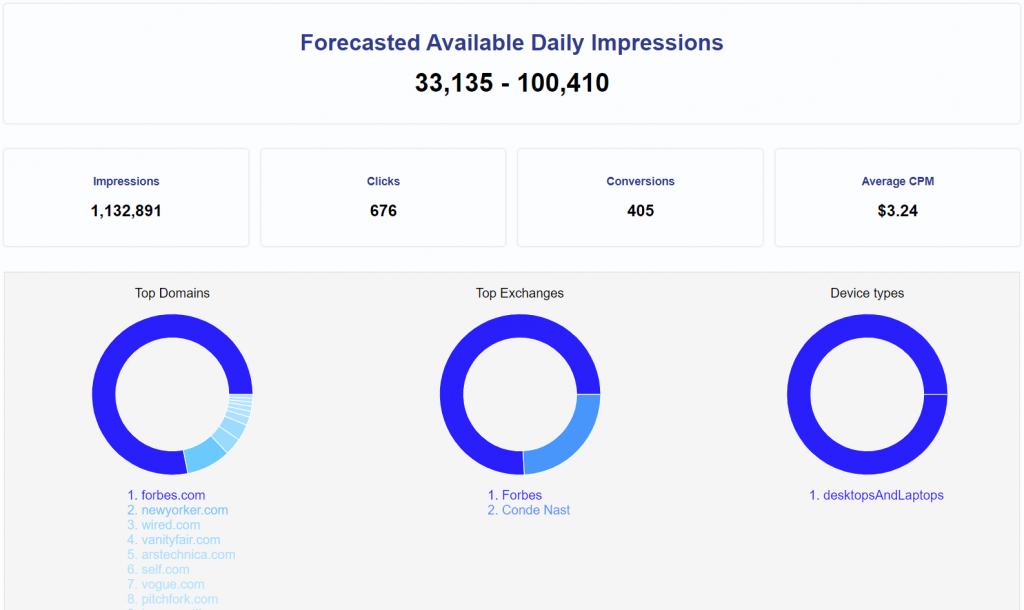
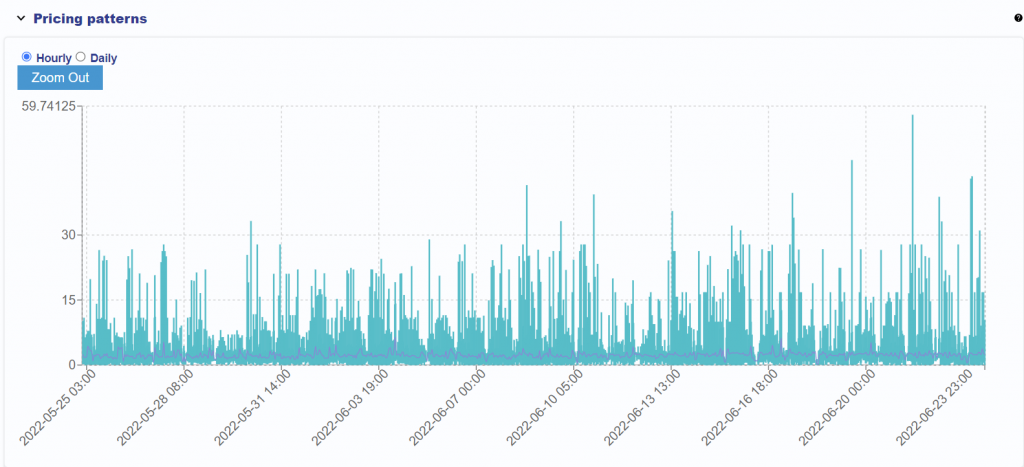
- Inventory Availability Tool
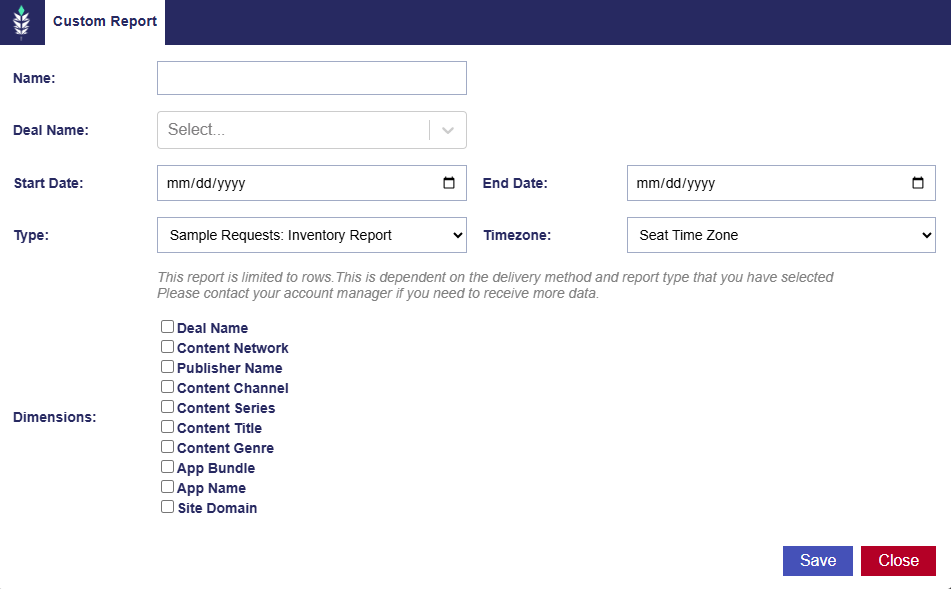
- The Inventory Availability Tool is a forecasting tool that provides directional guidance in campaign planning. Leveraging historical delivery data from the platform and a forecasting algorithm, Advertisers can input their desired targeting parameters to evaluate feasibility, potential scale, and cost for future campaigns. If your report returns no data, reach out through the Help Center for more information on the feasibility and potential scale for the selected targeting.
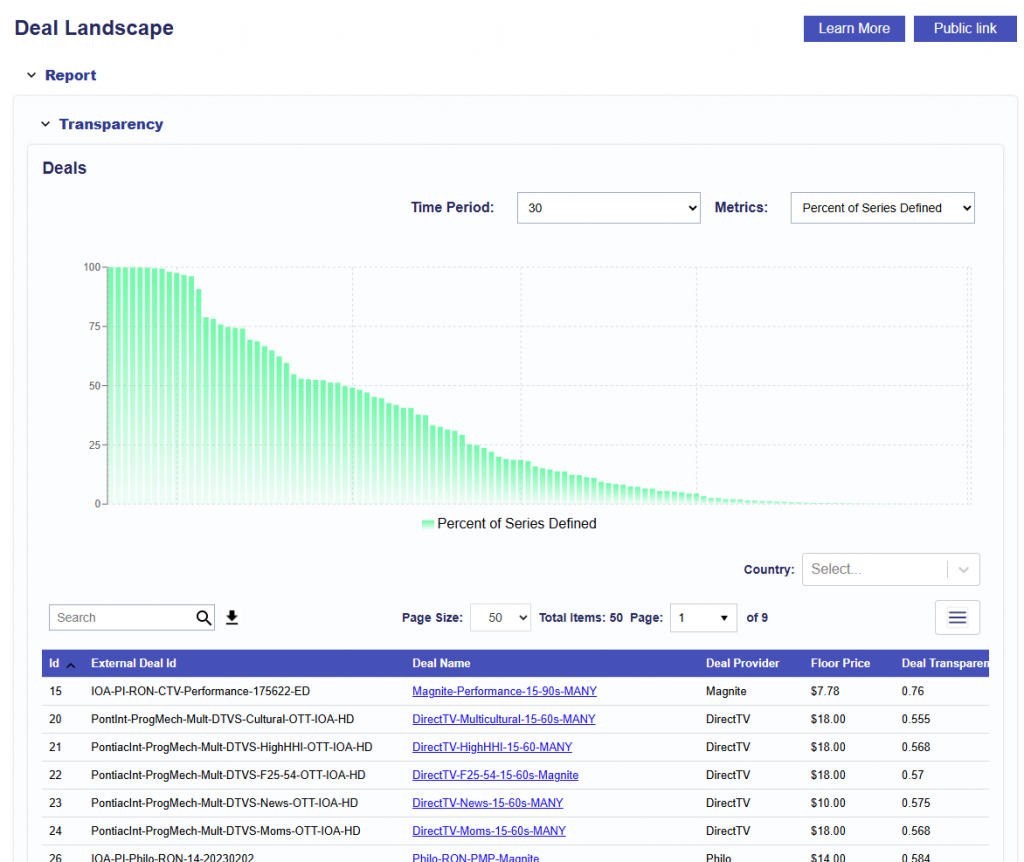
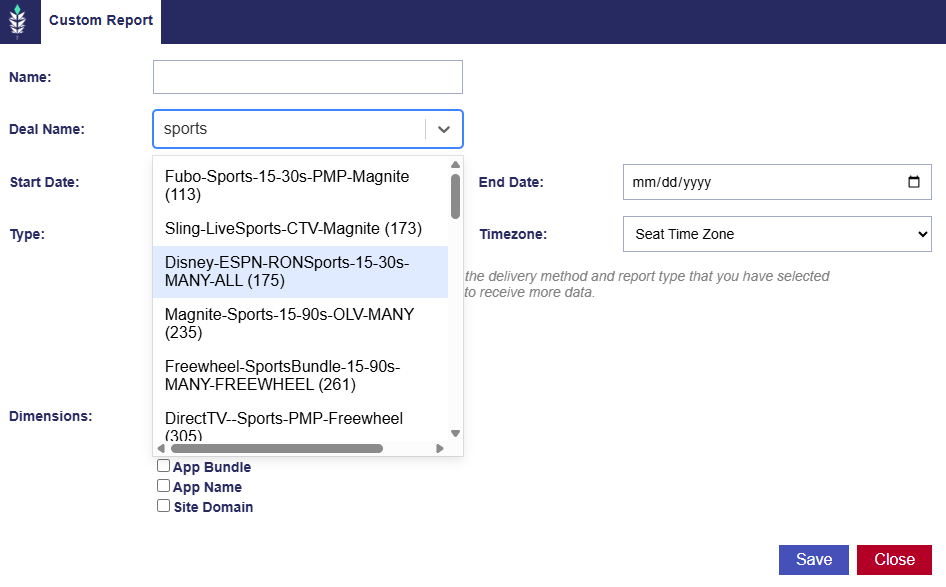
- Deal Landscape Tool
- The Deal Landscape tool provides transparent insights into the data available for targeting and reporting across the accessible Deals and Negotiated Deals through the Bidder. With great inconsistencies in the information shared by each media owner across the CTV industry, this tool can be leveraged in the research and planning process to align campaign goals and expectations with available targeting and reporting capabilities by Deal.
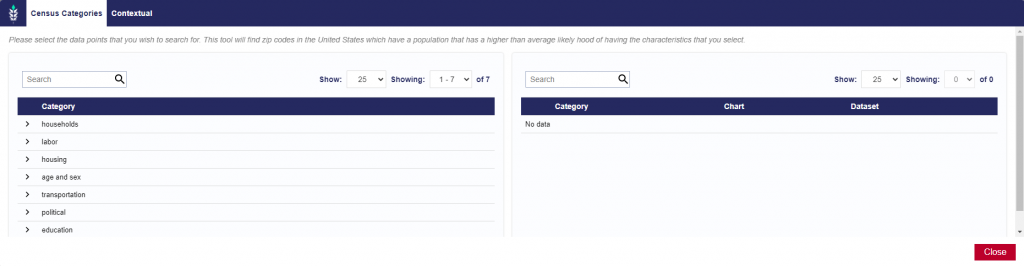
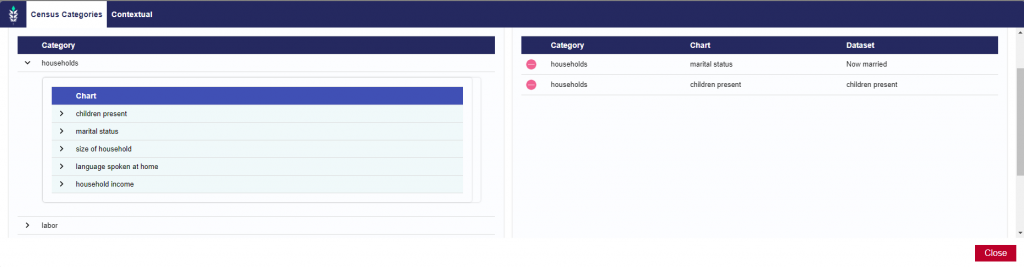
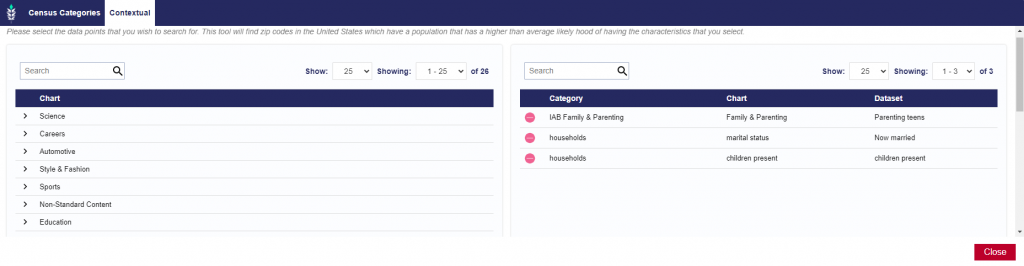
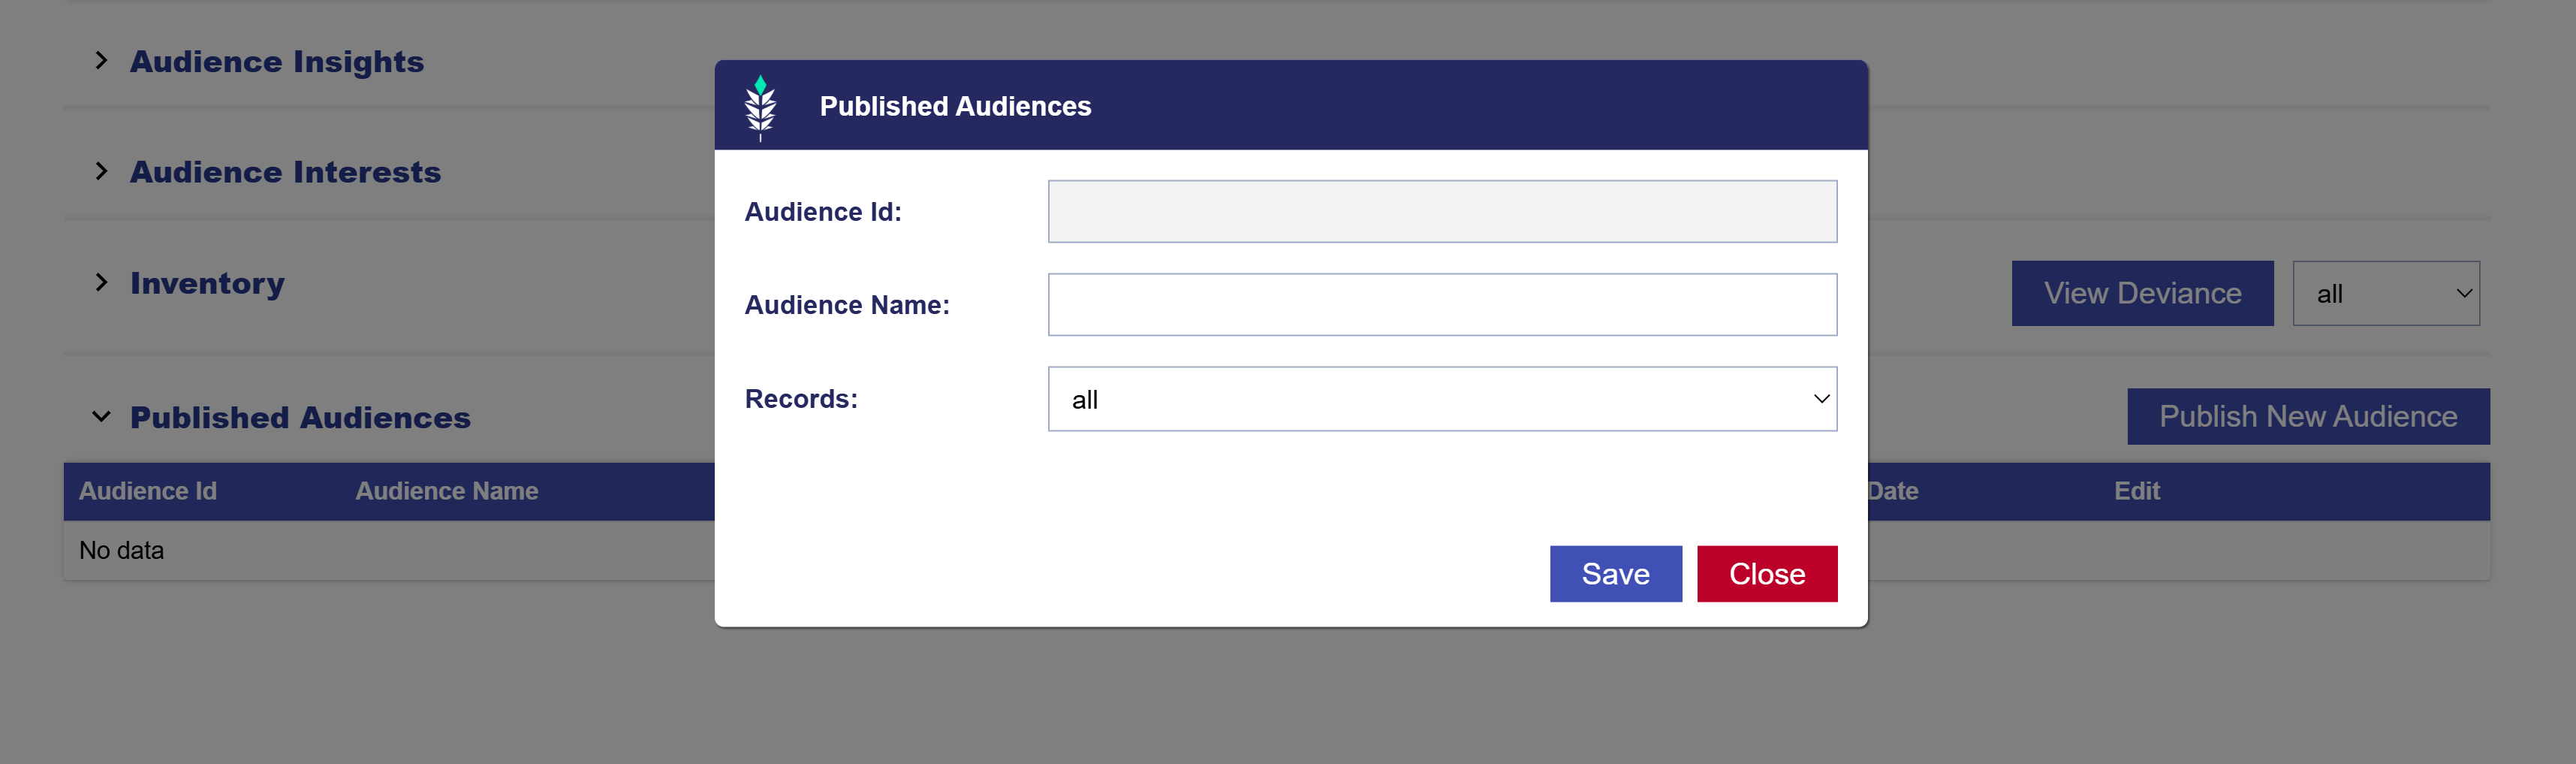
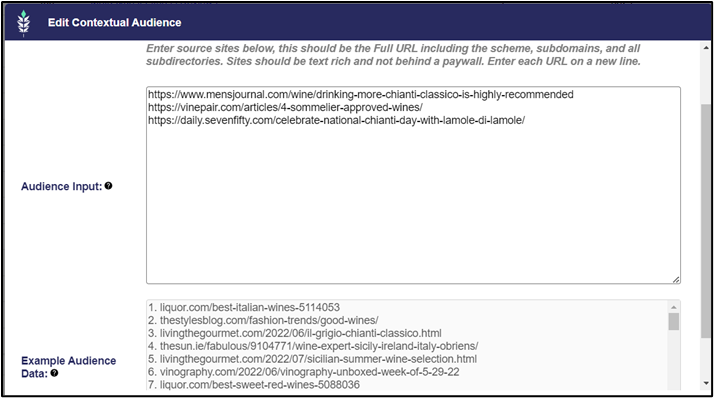
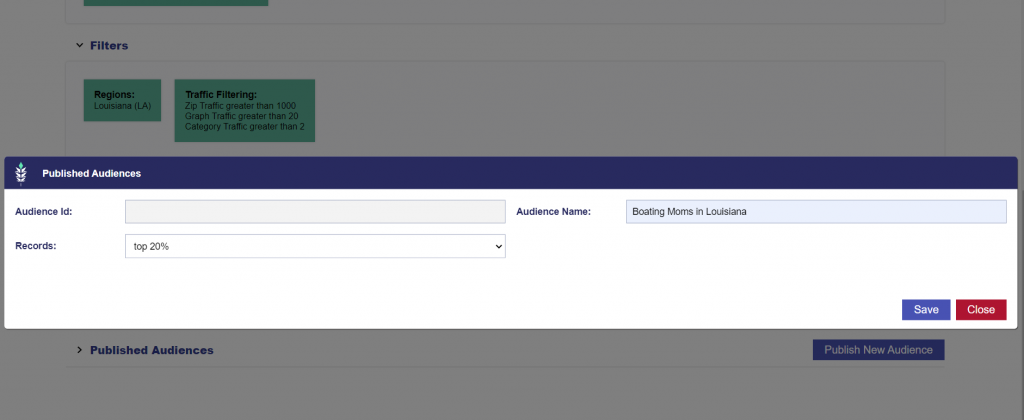
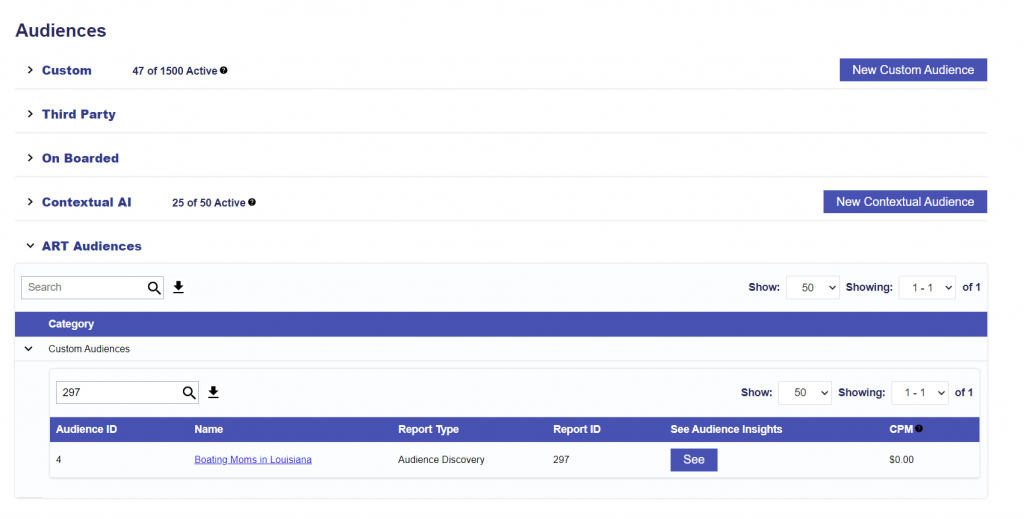
- Audiences Tool
- This section includes two core components: Contextual AI and ART Audiences.
- Contextual AI enables the creation of contextual segments by analyzing brand-relevant websites. Advertisers can input source URLs that reflect the type of content their target audience consumes. Each entry must include the full URL, including the scheme, subdomains, and all subdirectories, and should be text-rich and accessible (not hidden behind a paywall). By processing these sites, the AI identifies patterns and themes, generating audience segments that can be targeted within campaigns.
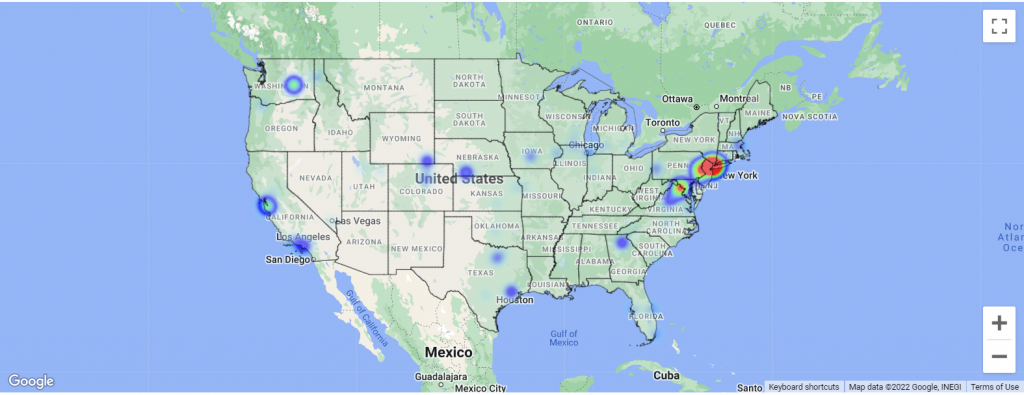
- ART Audiences provides access to both custom and public audiences. Custom audiences are built from the Audience Research or Audience Discovery Tools, while public audiences are pre-built syndicated segments available directly in the platform. For each audience, advertisers can explore detailed insight reports to understand where the audience is located, who makes up the audience demographically, and what behaviors or attributes define them. These insights make it easier to compare overlap, evaluate affinities, and design more effective targeting strategies.
- This section includes two core components: Contextual AI and ART Audiences.
Note that, at this time, all ART tools are limited to data for the United States.
If you would like access to the ART, reach out through the Help Center in the platform to request access.
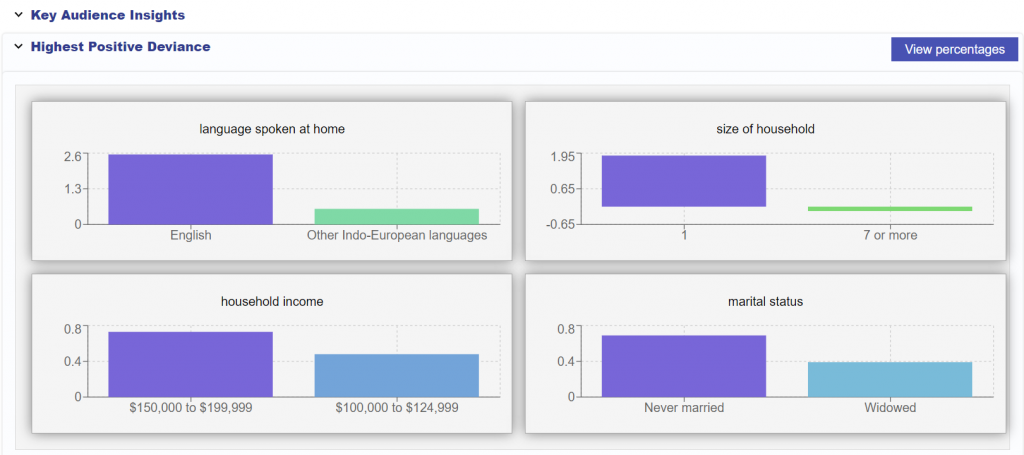
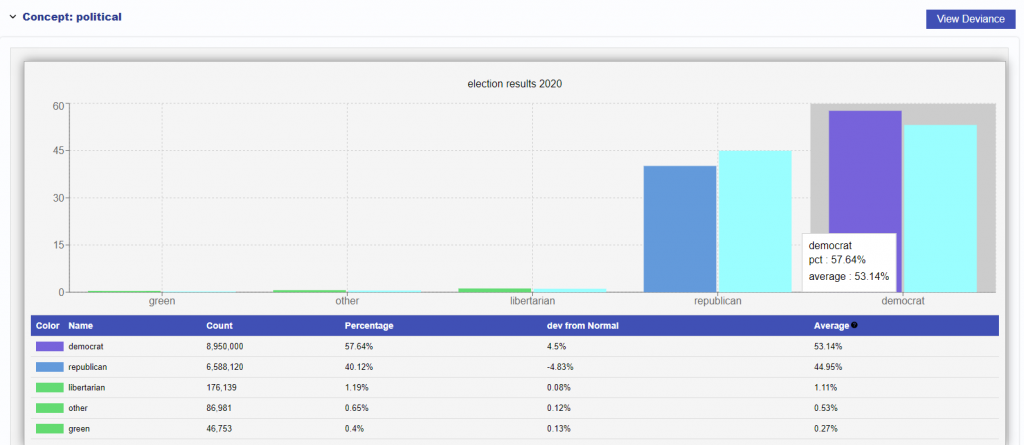
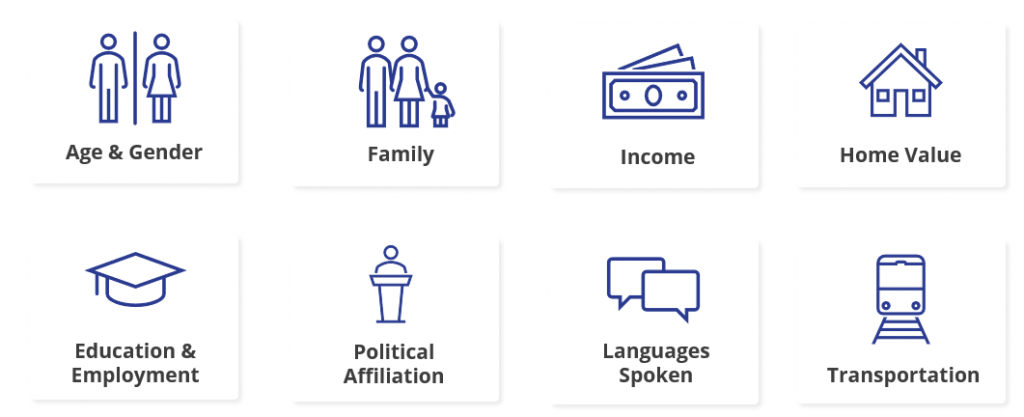
Demographic Data
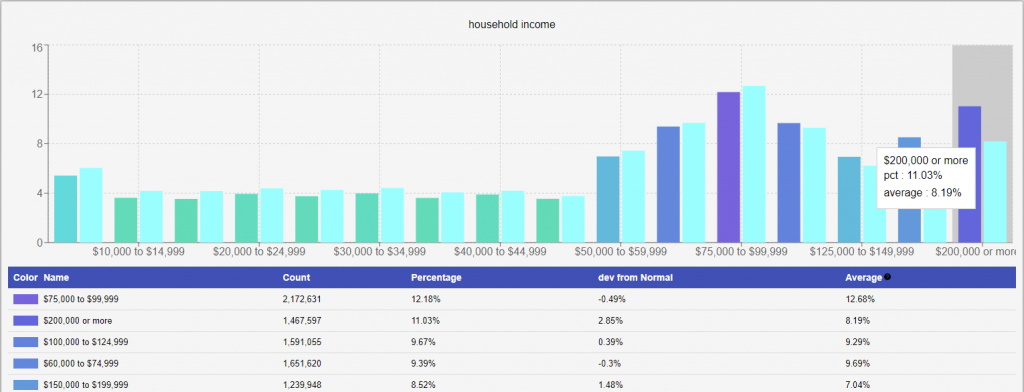
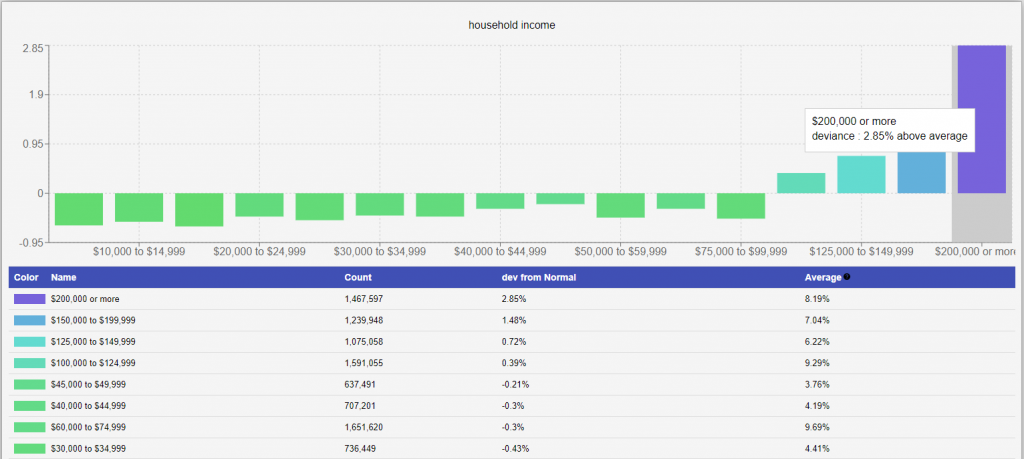
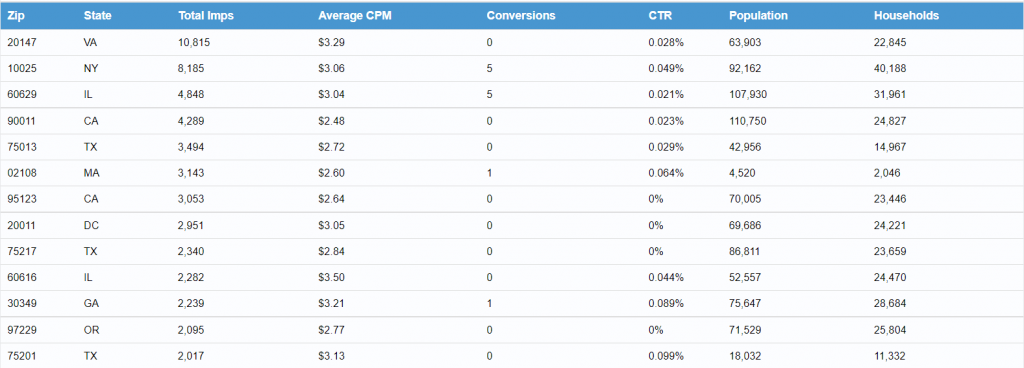
The deep ties between zip codes and demographics create a wealth of data for audience segmentation, leveraging U.S. Census data to find & target the profile of users with the strongest affinity for your brand:
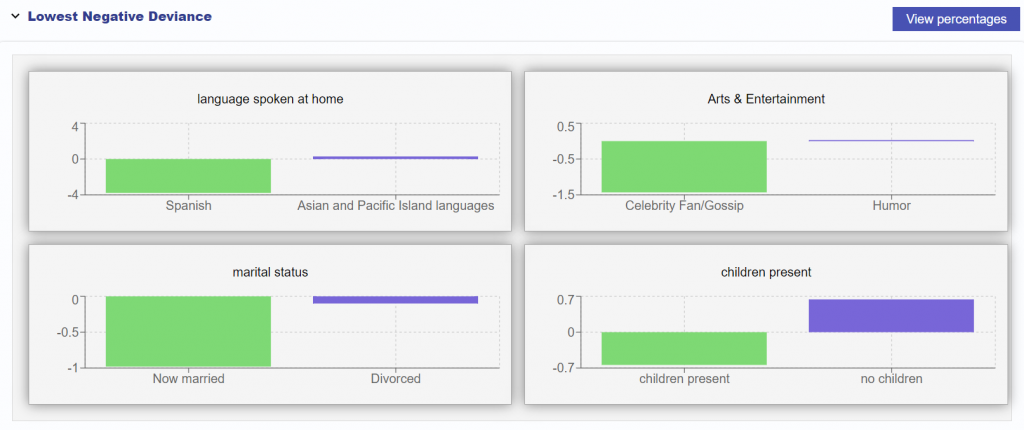
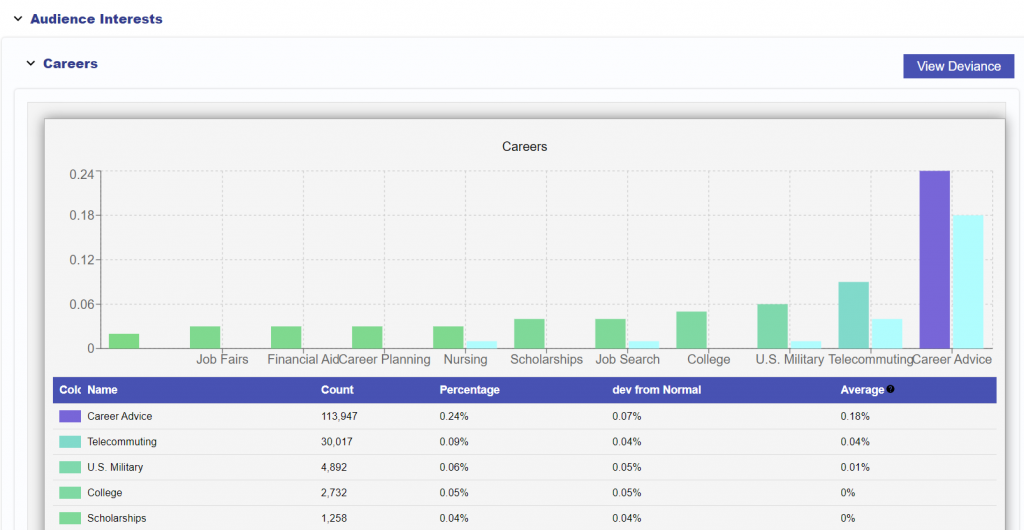
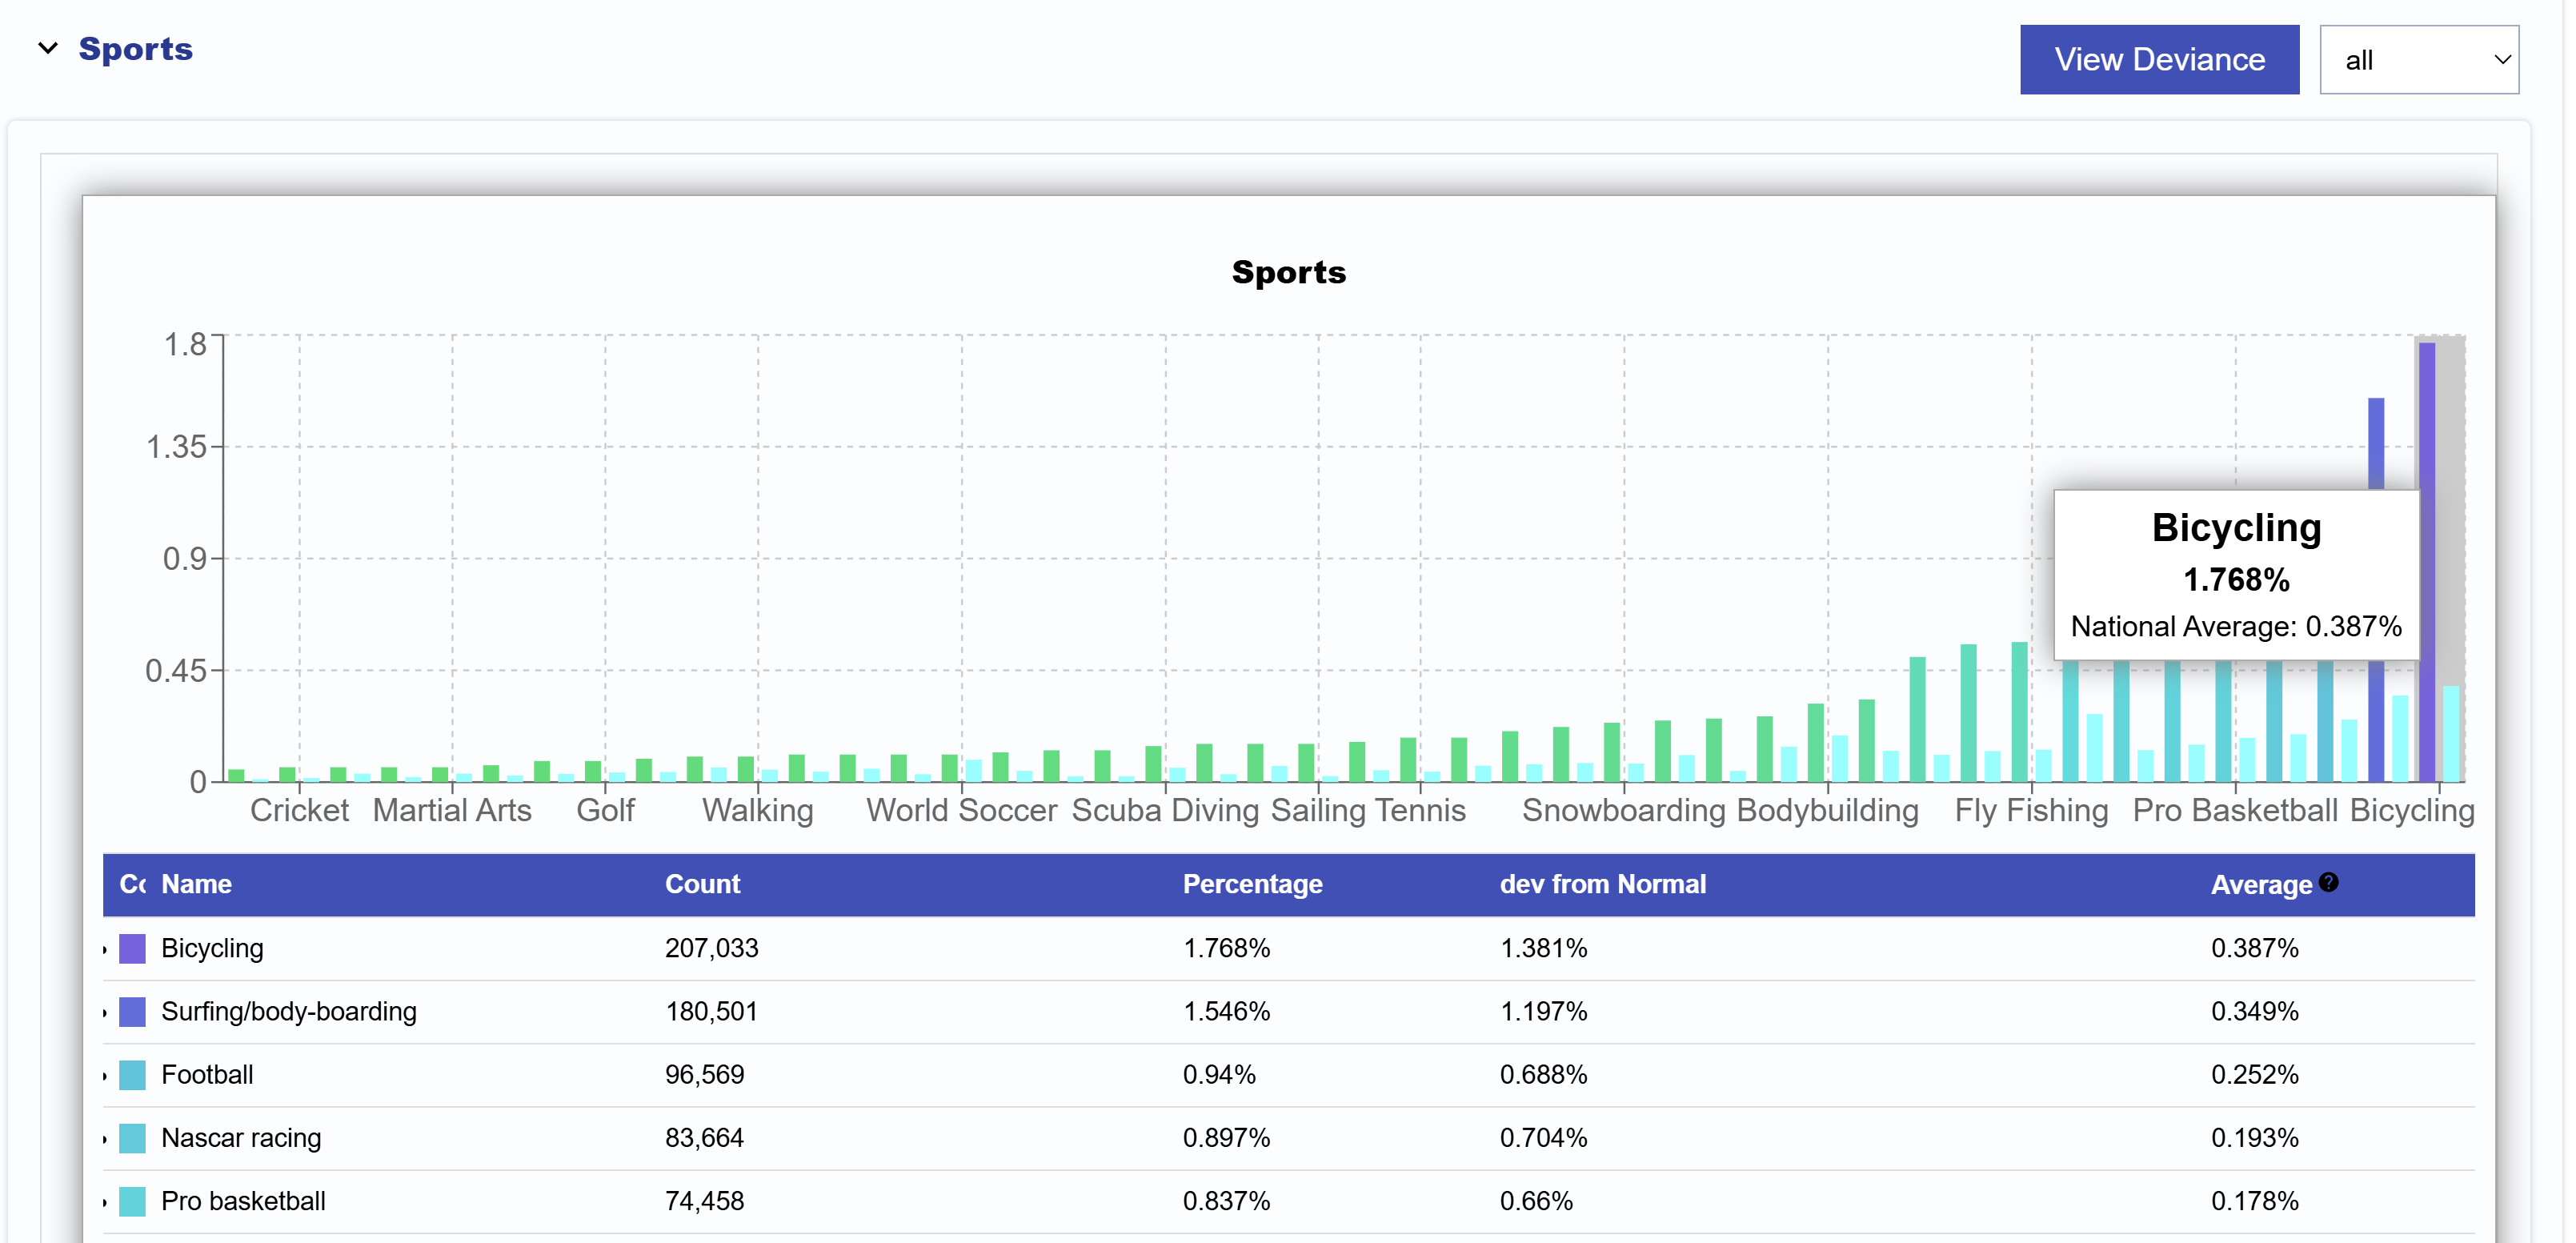
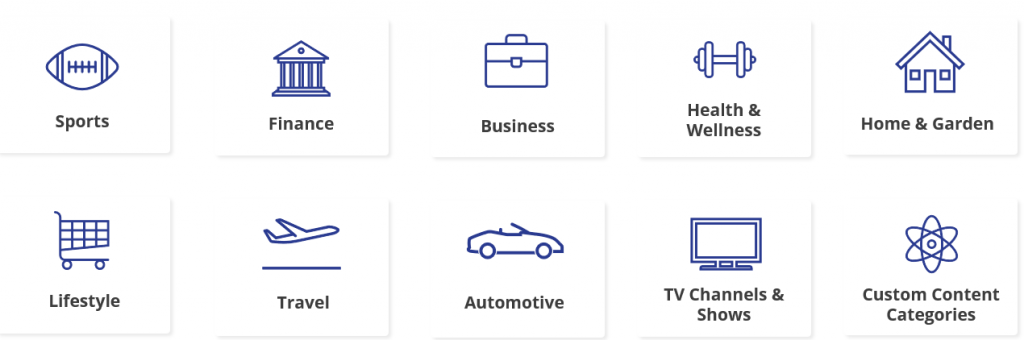
Interest Data
Leveraging AI for deep contextual analysis, Pontiac indexes content consumption by categories across the U.S. to build cookieless interest data according to what users are reading or streaming by zip code:
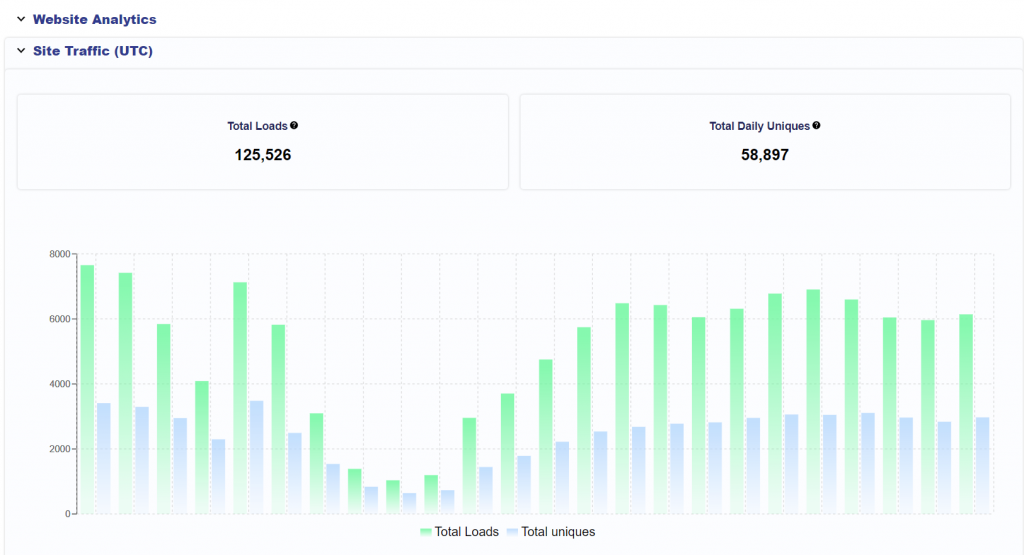
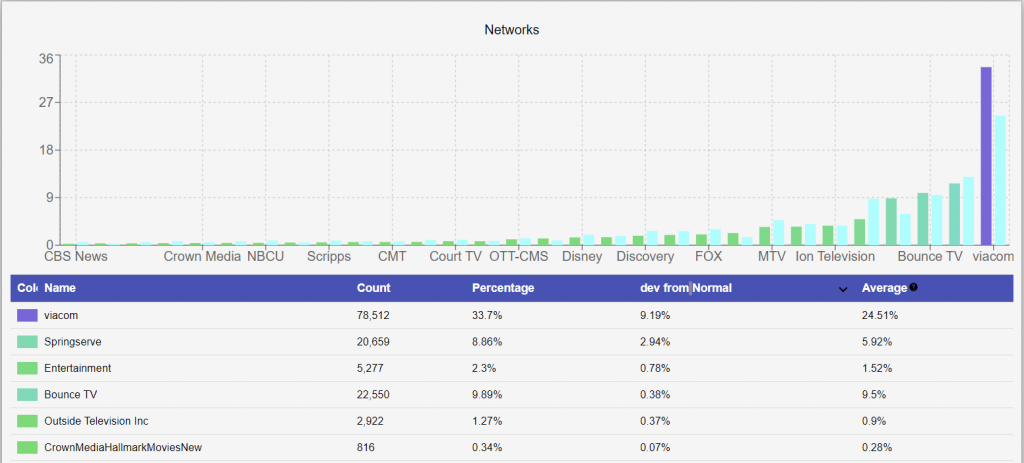
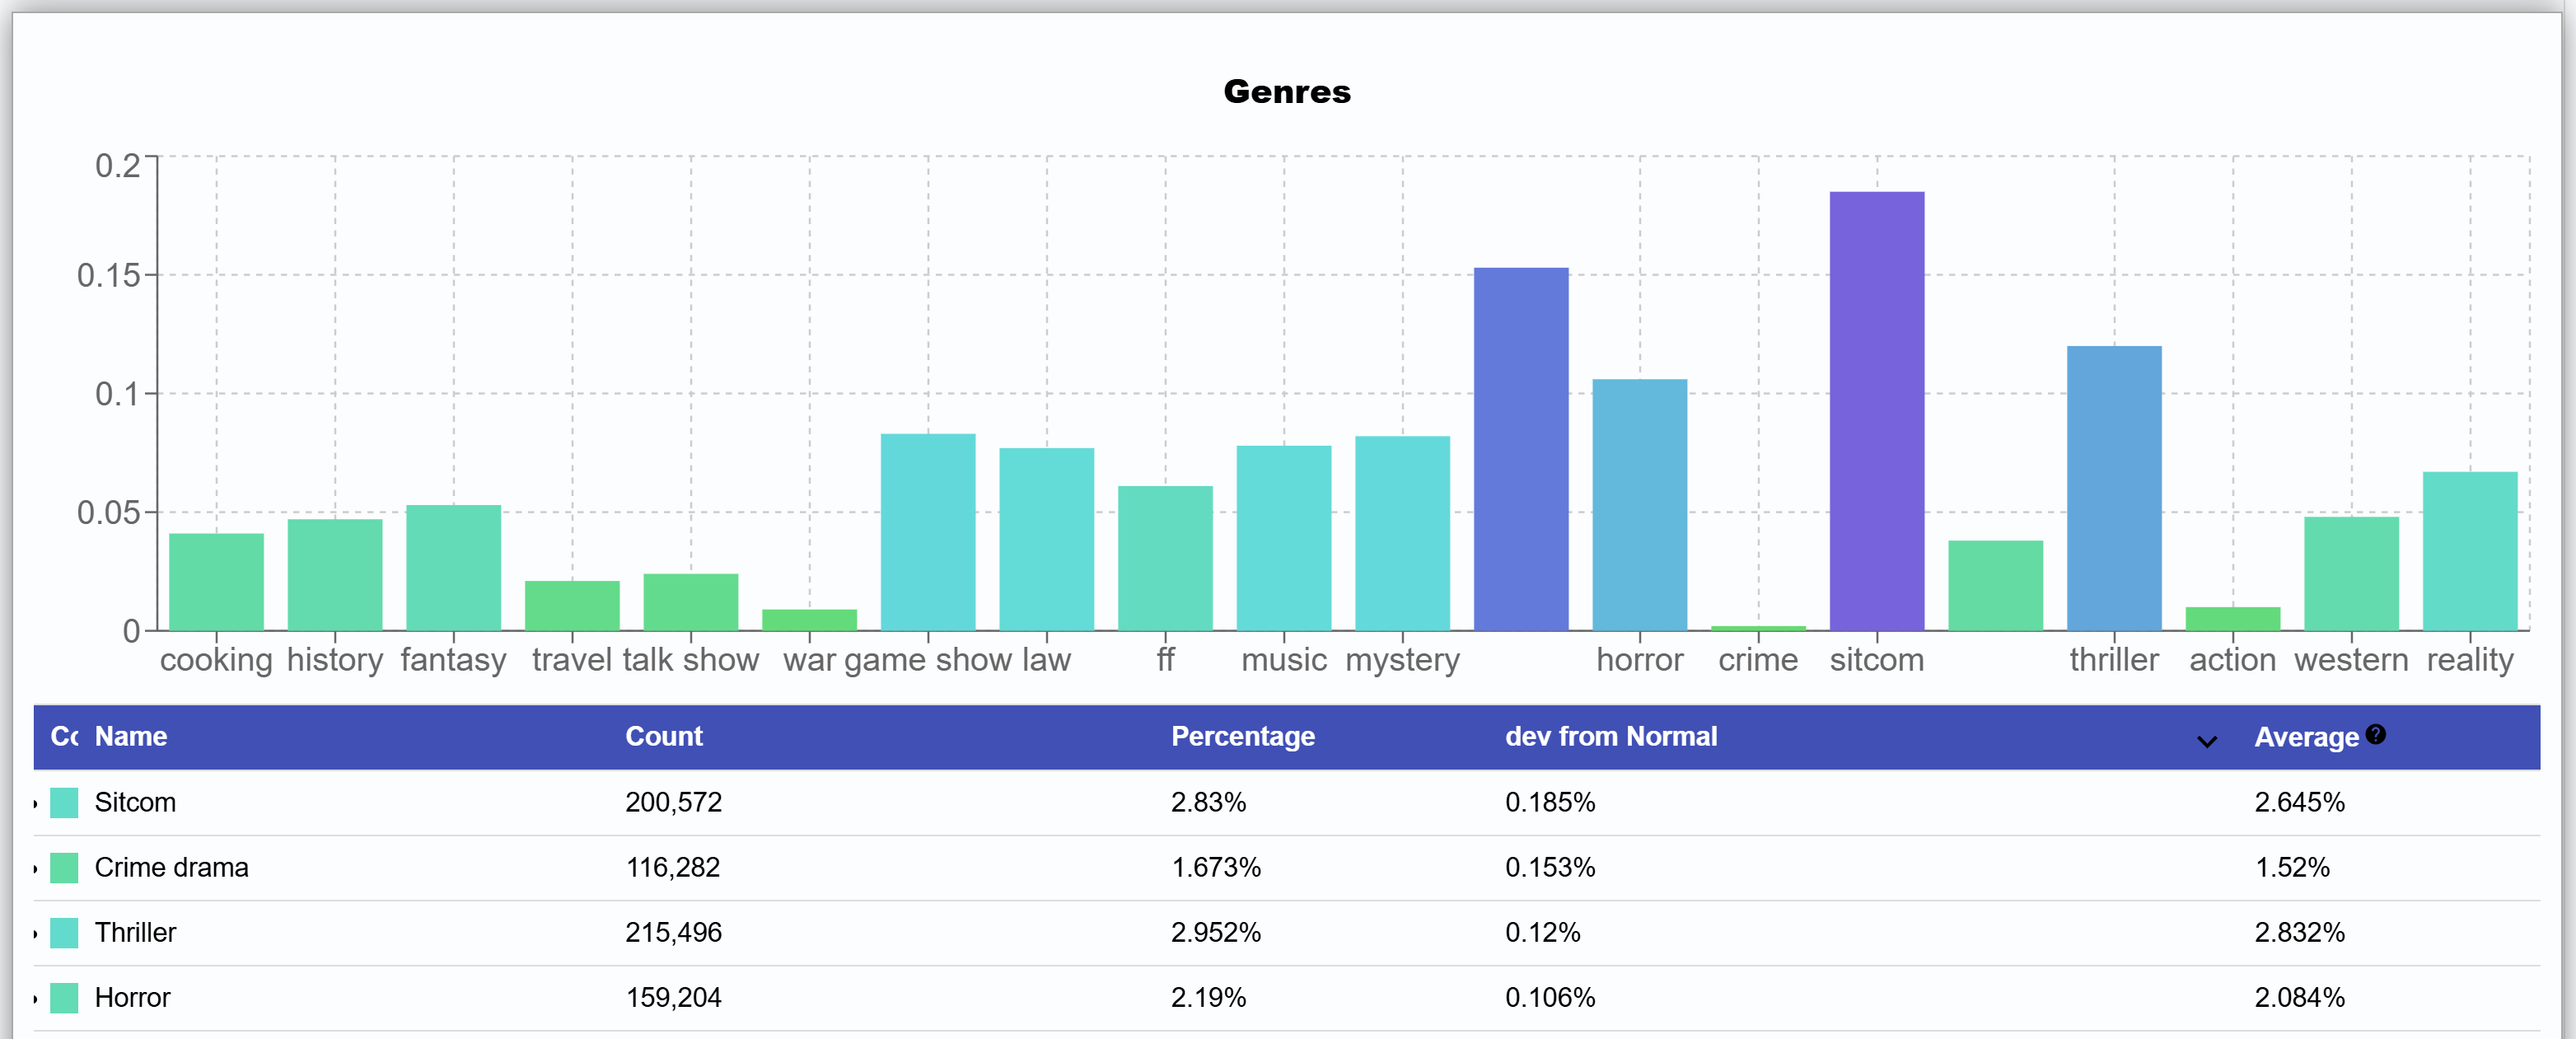
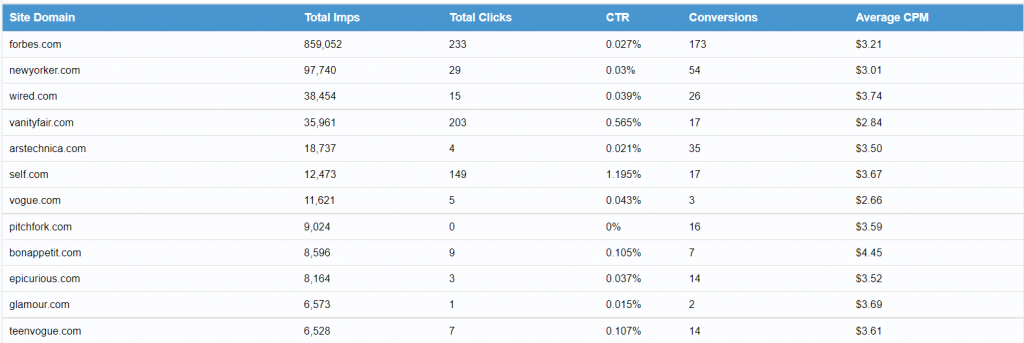
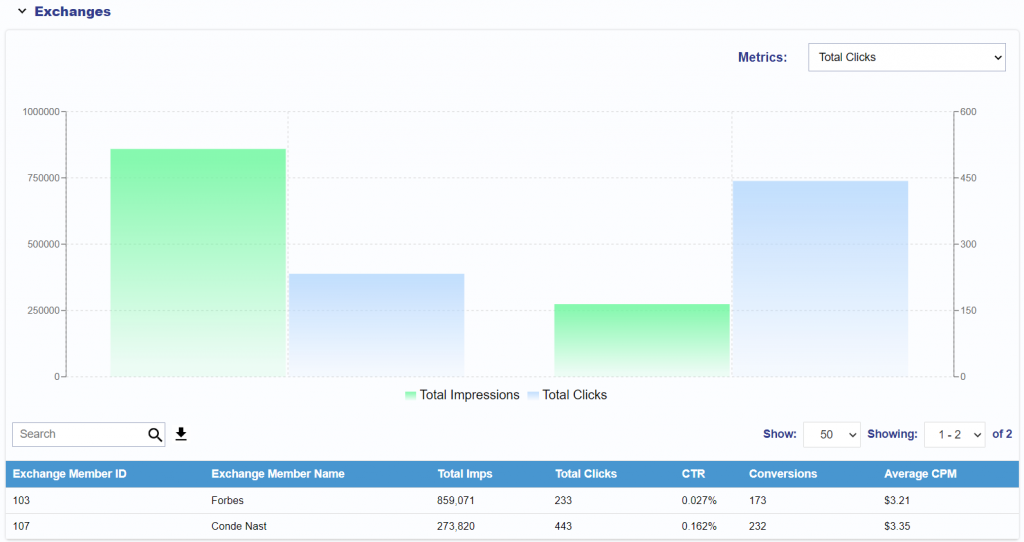
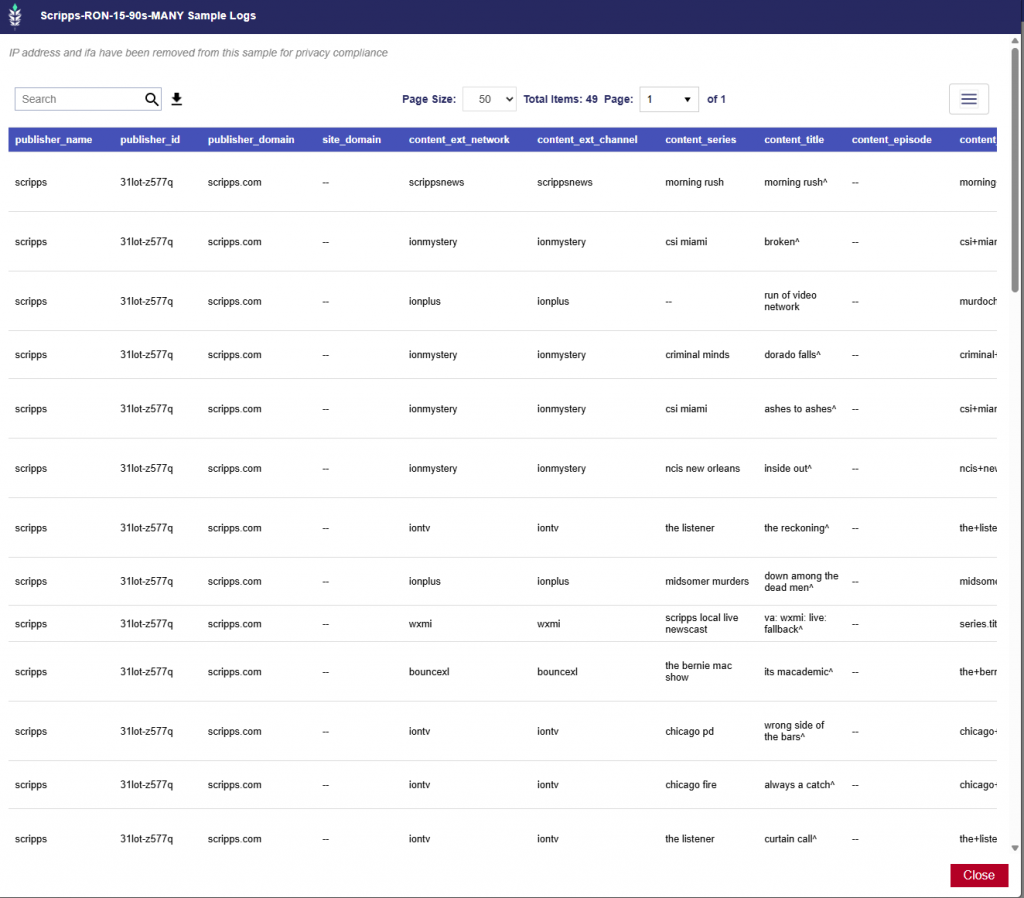
Inventory Data
Inventory data provides transparency into media supply, showing where impressions are available across genres, title, series, publishers, apps, channels, and networks. By analyzing inventory availability, advertisers can better understand the scale and quality of media opportunities for their campaigns. This data enables planning by revealing which channels (CTV, OLV, Display, App) are most relevant, what supply sources align with target audiences, and how much reach is realistically achievable within a given market.