Blockers Line Performance Graph
Release Date: August 4th, 2026
A new horizontal bar chart is available in Line Performance to show the percentage of bid requests blocked by each targeting category:
- Geography
- Deals
- Inventory
- Dayparting
- Audiences
- Creative
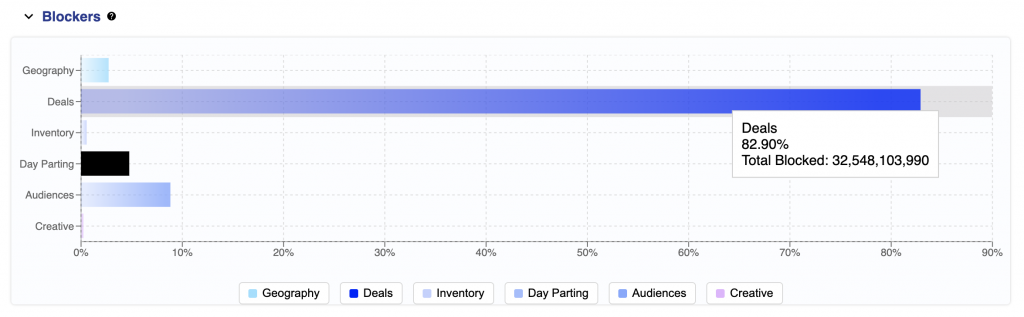
This horizontal bar graph shows the percentage of bid requests blocked by each category before the requests become eligible. Category percentages are calculated independently, so the chart is not a step-by-step funnel and the same request may be counted in more than one category. Total Blocked shows the number of requests blocked by that category. Click a category in the legend to hide or restore it, and the chart will automatically rescale.