Inventory
The Inventory dropdown section features both a chart and a table to help you analyze campaign performance by inventory source. The chart can be filtered by categories such as Site Domain, Exchange, Publisher, Series, Title, and Genre, and metrics such as Total Cost, Revenue, Total Cost CPM, and Transparency Score, offering flexible insight into impression and cost trends.
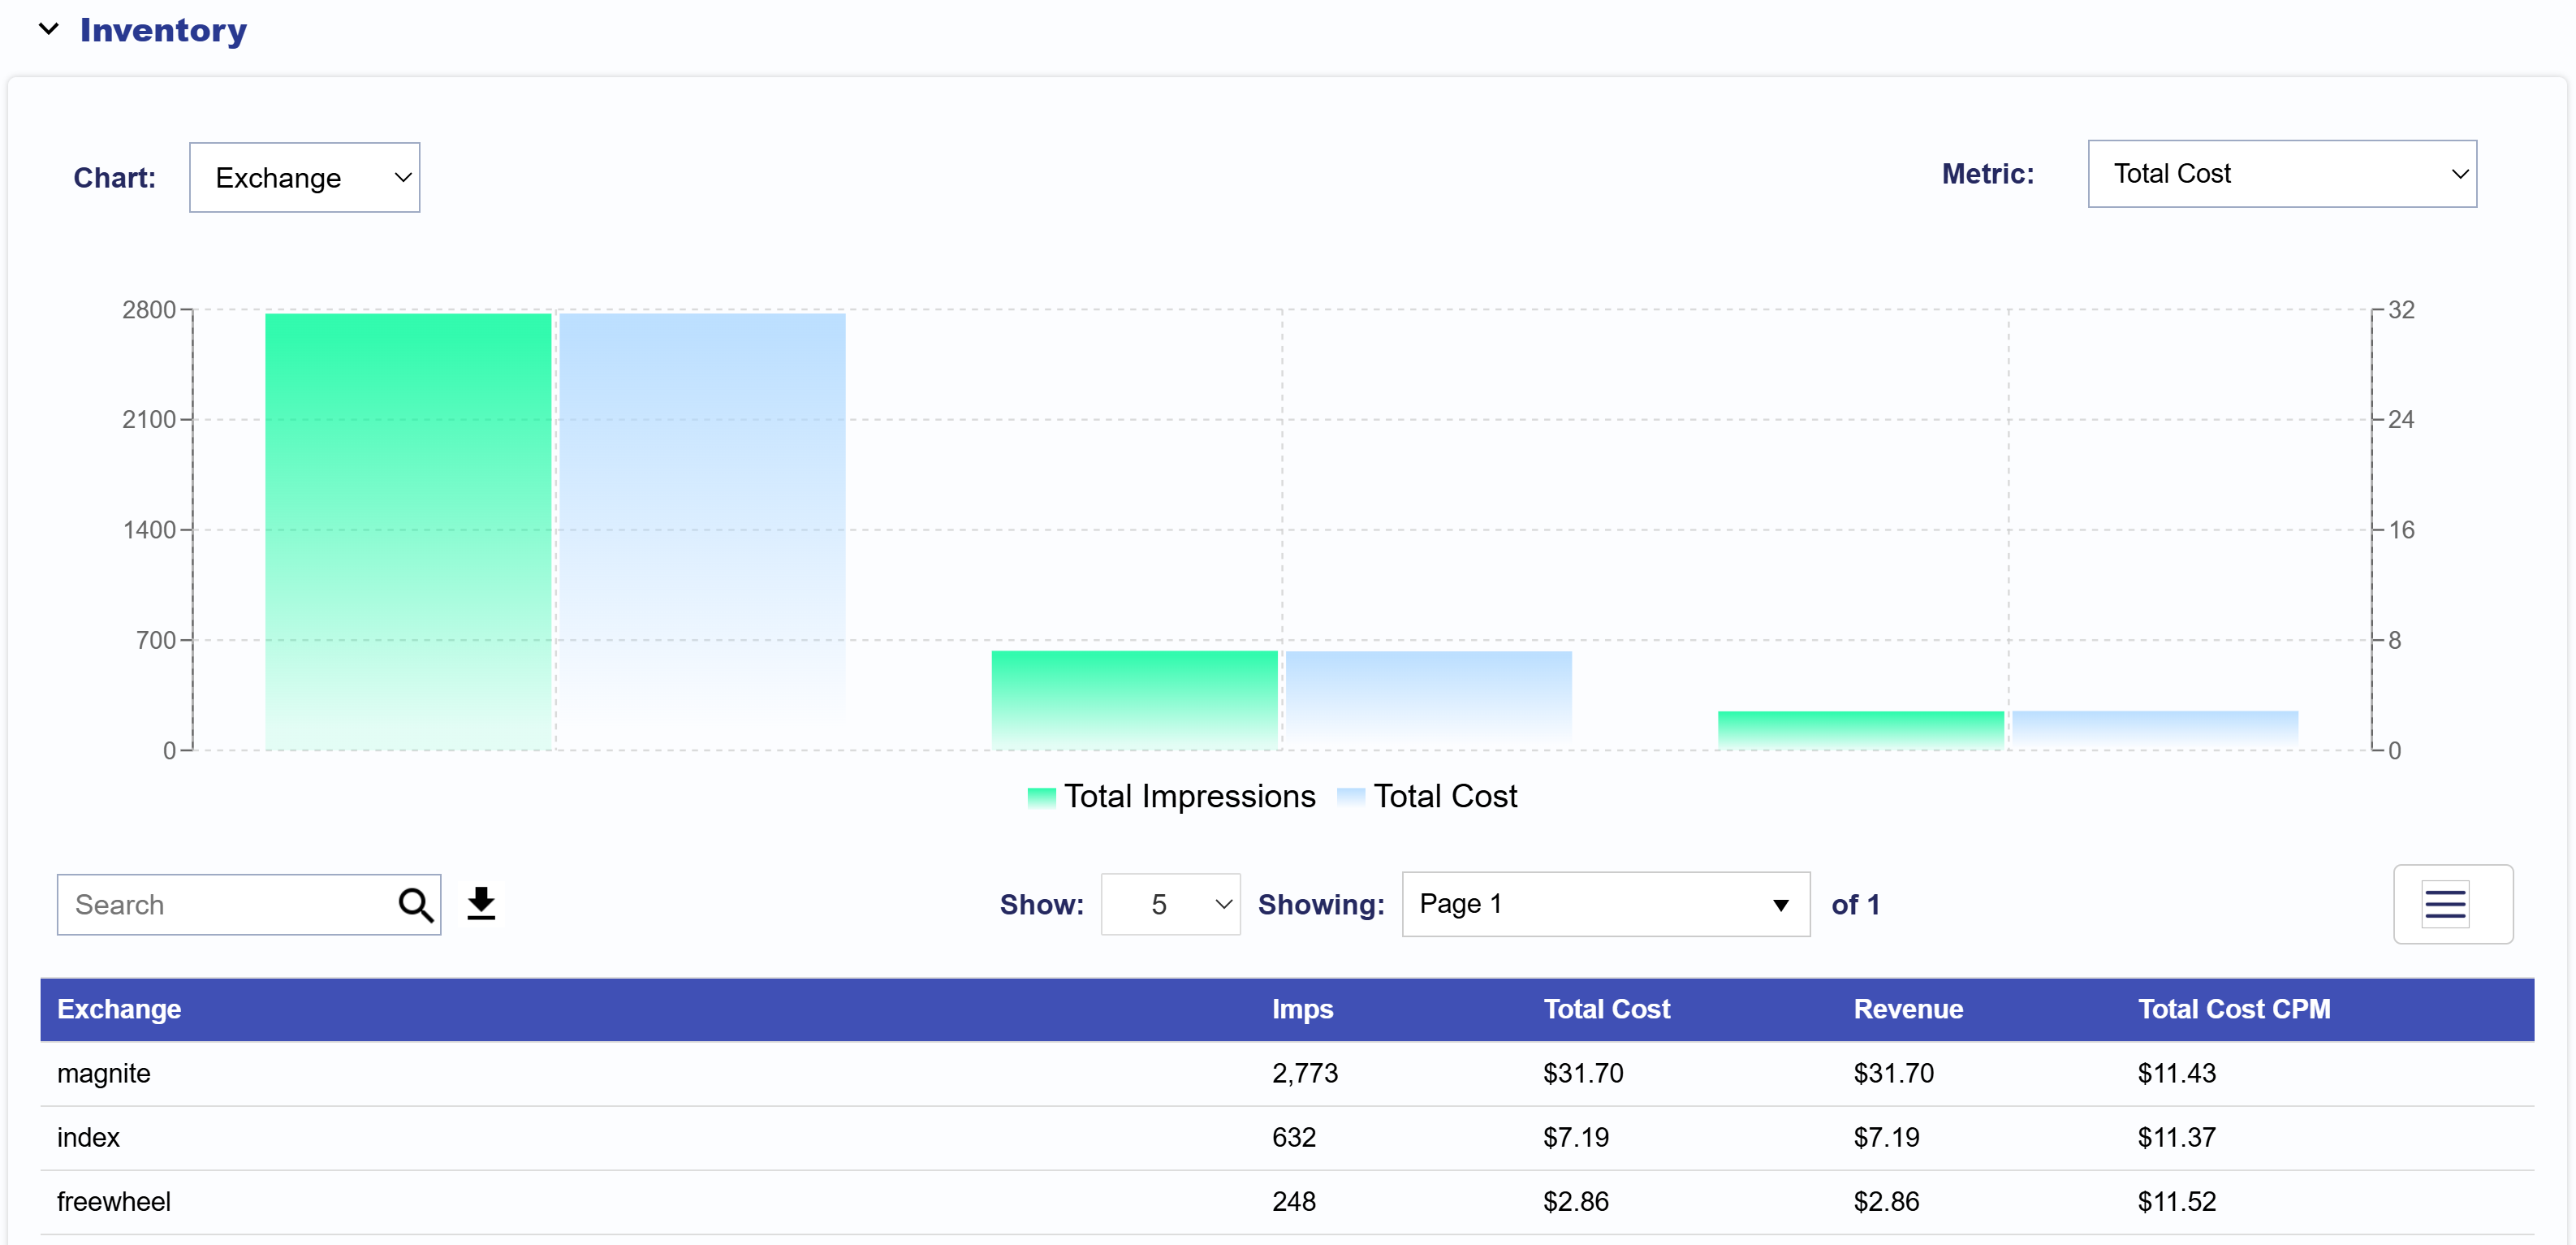
The bar chart displays the selected category and metric. Hover over each bar pair to view the Category Name, Total Impressions, and Total Cost. To adjust how many are shown, use the Show: dropdown to display 5, 10, 25, 50, or 100 results.
To export data, go to the Table section. On the right side of the search bar, click the download icon to export the table as a CSV file. All metrics mentioned above are included as well as impressions. To customize the export, click the three line icon in the top right of the table to select or deselect the metrics most relevant to your analysis.