Deal
The Deal section includes a chart and table for comparing performance across Deals based on the selected Advertiser, Campaign, Lines, and Reporting Interval.
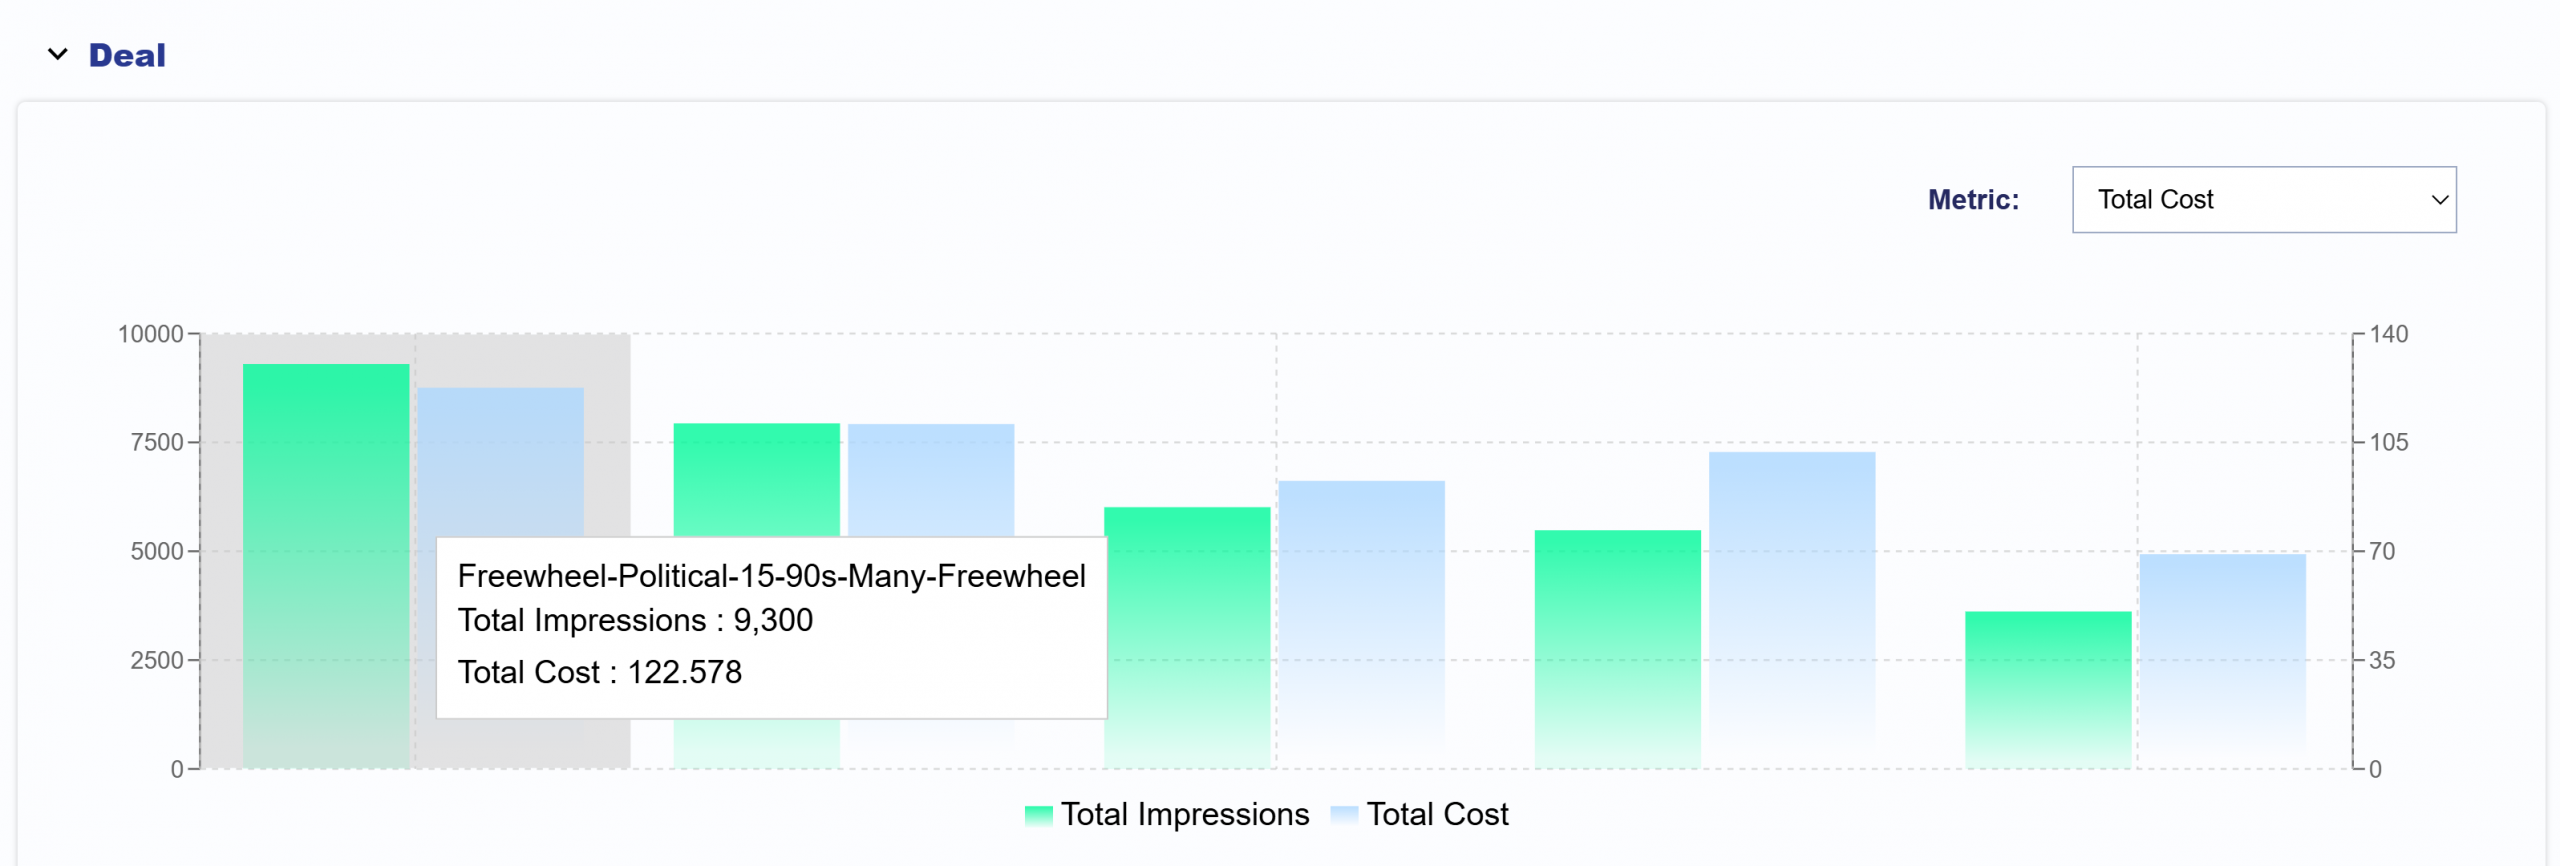
The chart displays Total Impressions alongside the selected performance metric. Use the metric dropdown to compare Impressions against:
- Total Cost
- Revenue
- Total Cost CPM
- CTR
- Transparency Score
The left Y-axis displays Impressions, while the right Y-axis displays the selected metric, making it easier to compare delivery and performance across Deals.
Deal Table
The table provides detailed performance metrics for each Deal.
Select the Download icon to export the table as a CSV file. Use the three-line menu in the upper-right corner of the table to choose which columns are displayed and customize the view.
Available columns include:
- Deal: The name of the Deal.
- Imps: The total number of Impressions served through the Deal.
- Clicks: The total number of clicks attributed to the Deal.
- Total Cost: The total cost attributed to the Deal.
- Revenue: The total amount billed to the Advertiser for Impressions served through the Deal, calculated as Total Cost plus the Advertiser Margin.
- Total Cost CPM: The total cost per thousand Impressions.
- CTR: The click-through rate, calculated as Clicks divided by Impressions.
- Transparency Score: The score indicating the level of inventory transparency associated with the Deal.