App
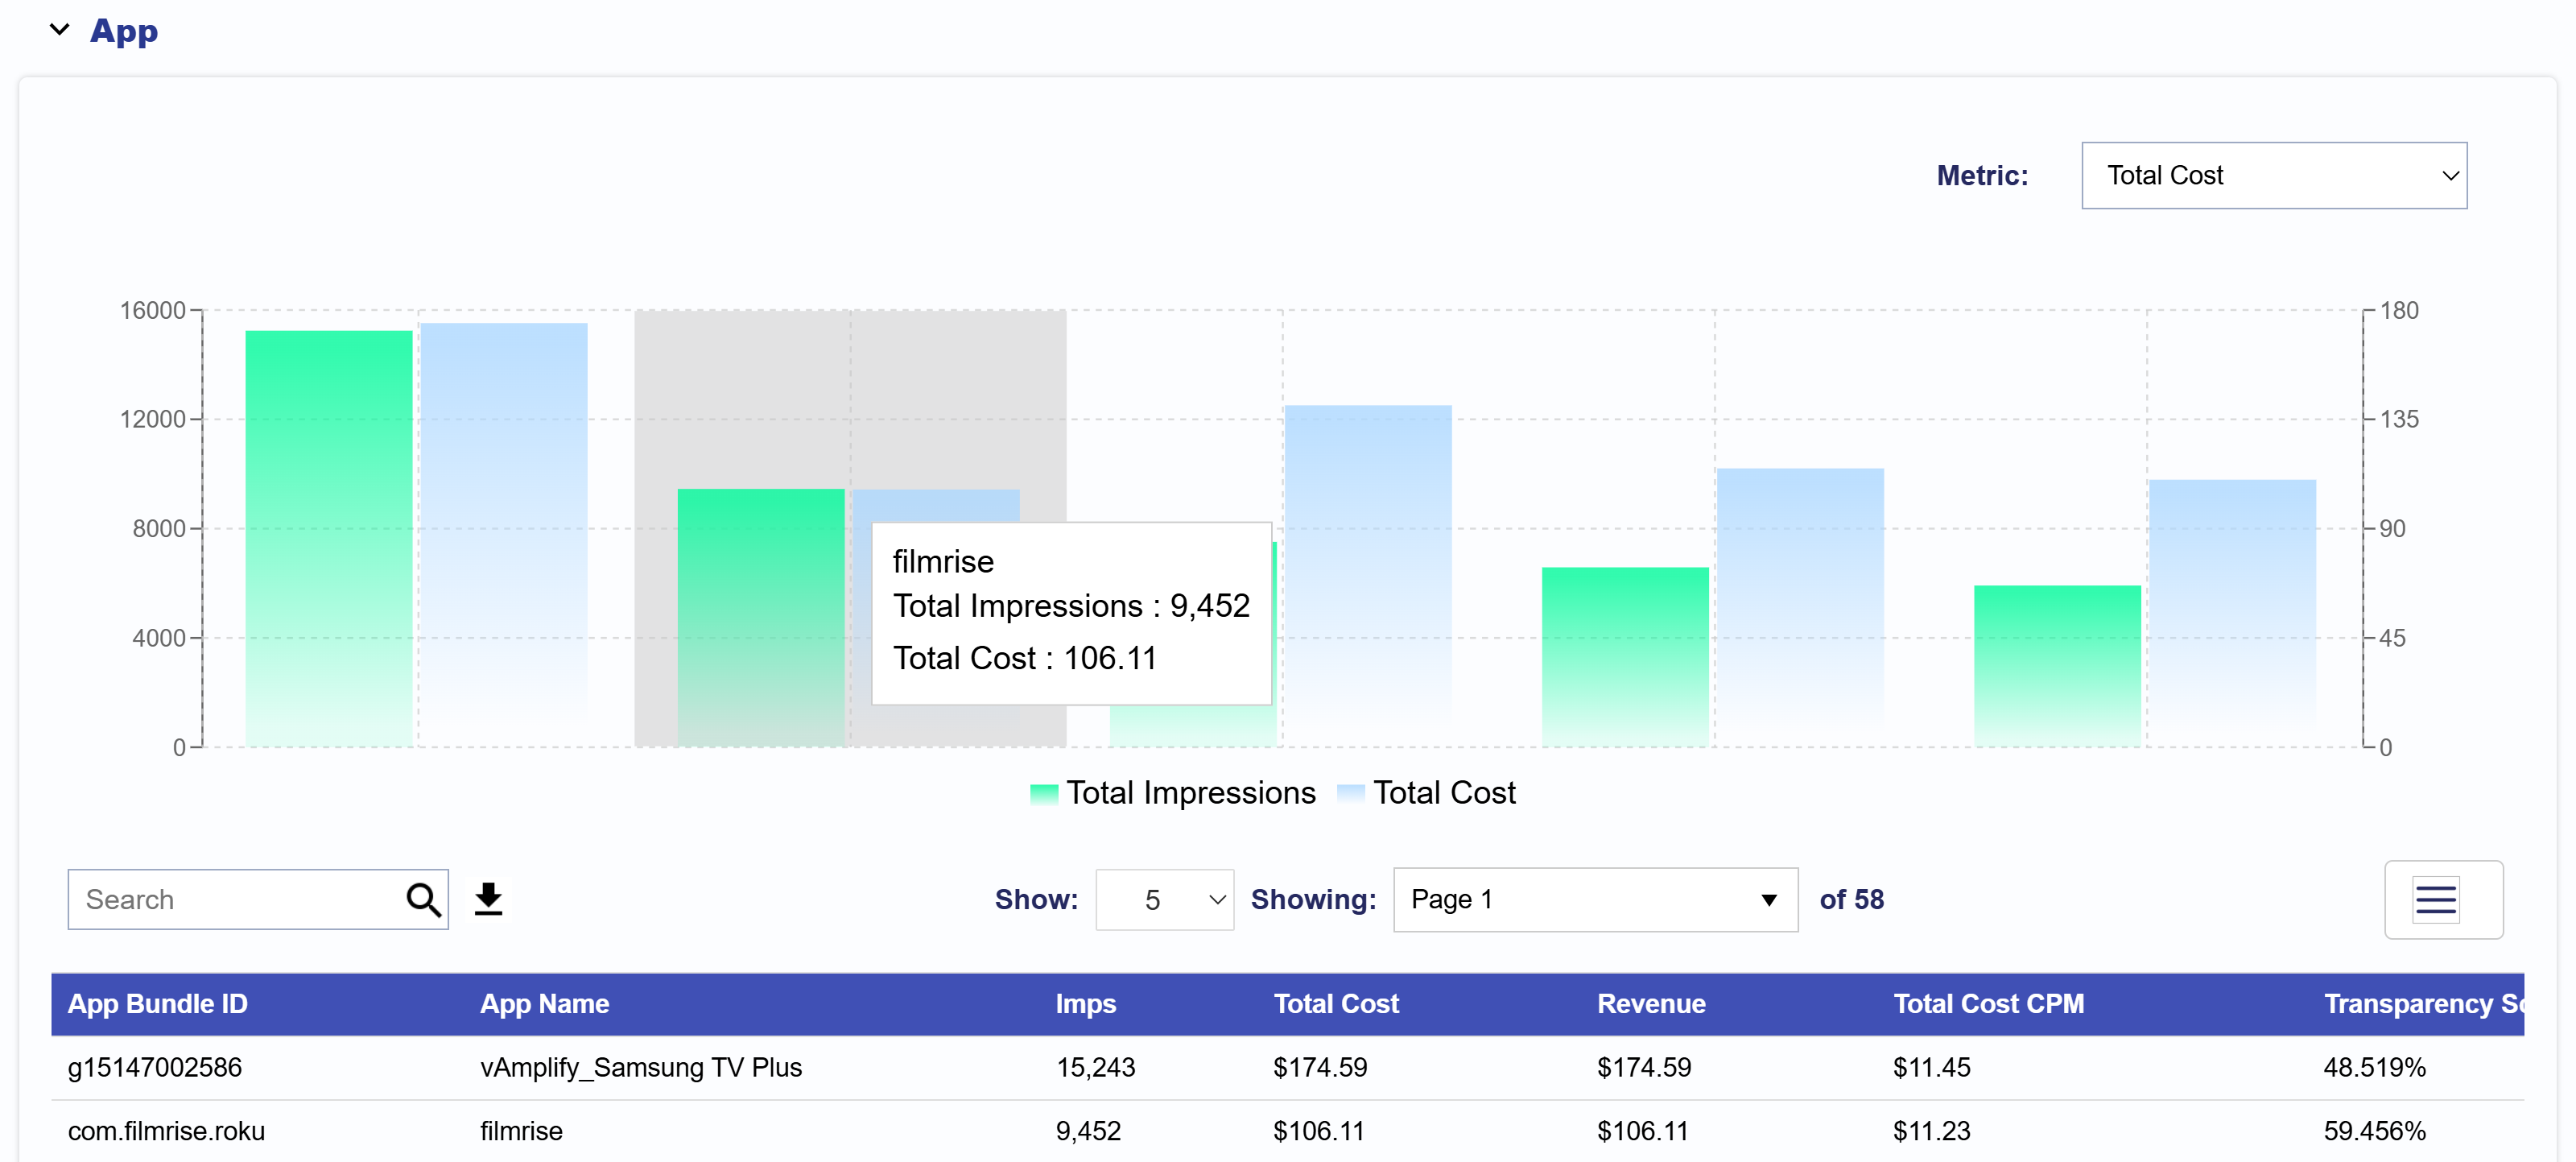
The App section displays a chosen metric and Impressions for each app associated with the selected Advertiser, Campaign, and Lines in the top filter section, based on the selected reporting interval. The data is broken down by app, allowing you to compare performance across different apps. The left Y-axis shows Impression counts, while the right Y-axis shows your chosen metric, making it easy to compare delivery and spend across apps at a glance.
You can adjust the metric compared to Total Impressions to show Total Cost, Revenue, Total Cost CPM, Completion Rate, or Transparency Score for more customized analysis.
To export this data, scroll down to the Table section below the chart. On the right side of the search bar, click the Download icon to export the table as a CSV file. You can further customize your export by clicking the three-line icon in the top right corner of the table to select or deselect the metrics that are most relevant to your analysis.
- App: The name of the App.
- Imps: The total number of impressions served by each App.
- Total Cost: The total spend attributed to each App.
- Revenue: The revenue generated by each App.
- Total Cost CPM: The cost per thousand impressions (CPM) for each App.
- Transparency Score: A score indicating the transparency level of the App, helping assess the clarity of supply source information and ad placement.