Pontiac Wiki Pontiac Wiki

Reporting

Reporting

  • Standard Reporting
    • Overview
    • Summary
    • Inventory
    • Creatives
    • Device Type
    • Network
    • Deal
    • Channel
    • App
    • Foot Traffic
    • Geo
  • Custom Reporting
    • Overview
    • Scheduled Reports
    • Custom Report
    • IP Conversion Pixel: Path To Conversion
    • IP Conversion Pixel: Page Visits
    • IP Conversion Pixel: Conversion Rate
    • Log Level Reporting
    • Reach/Frequency Report
  • Conversion Tracking
  • Foot Traffic Studies
    • Overview
  1. Home
  2. CTV Documentation
  3. Reporting

Overview

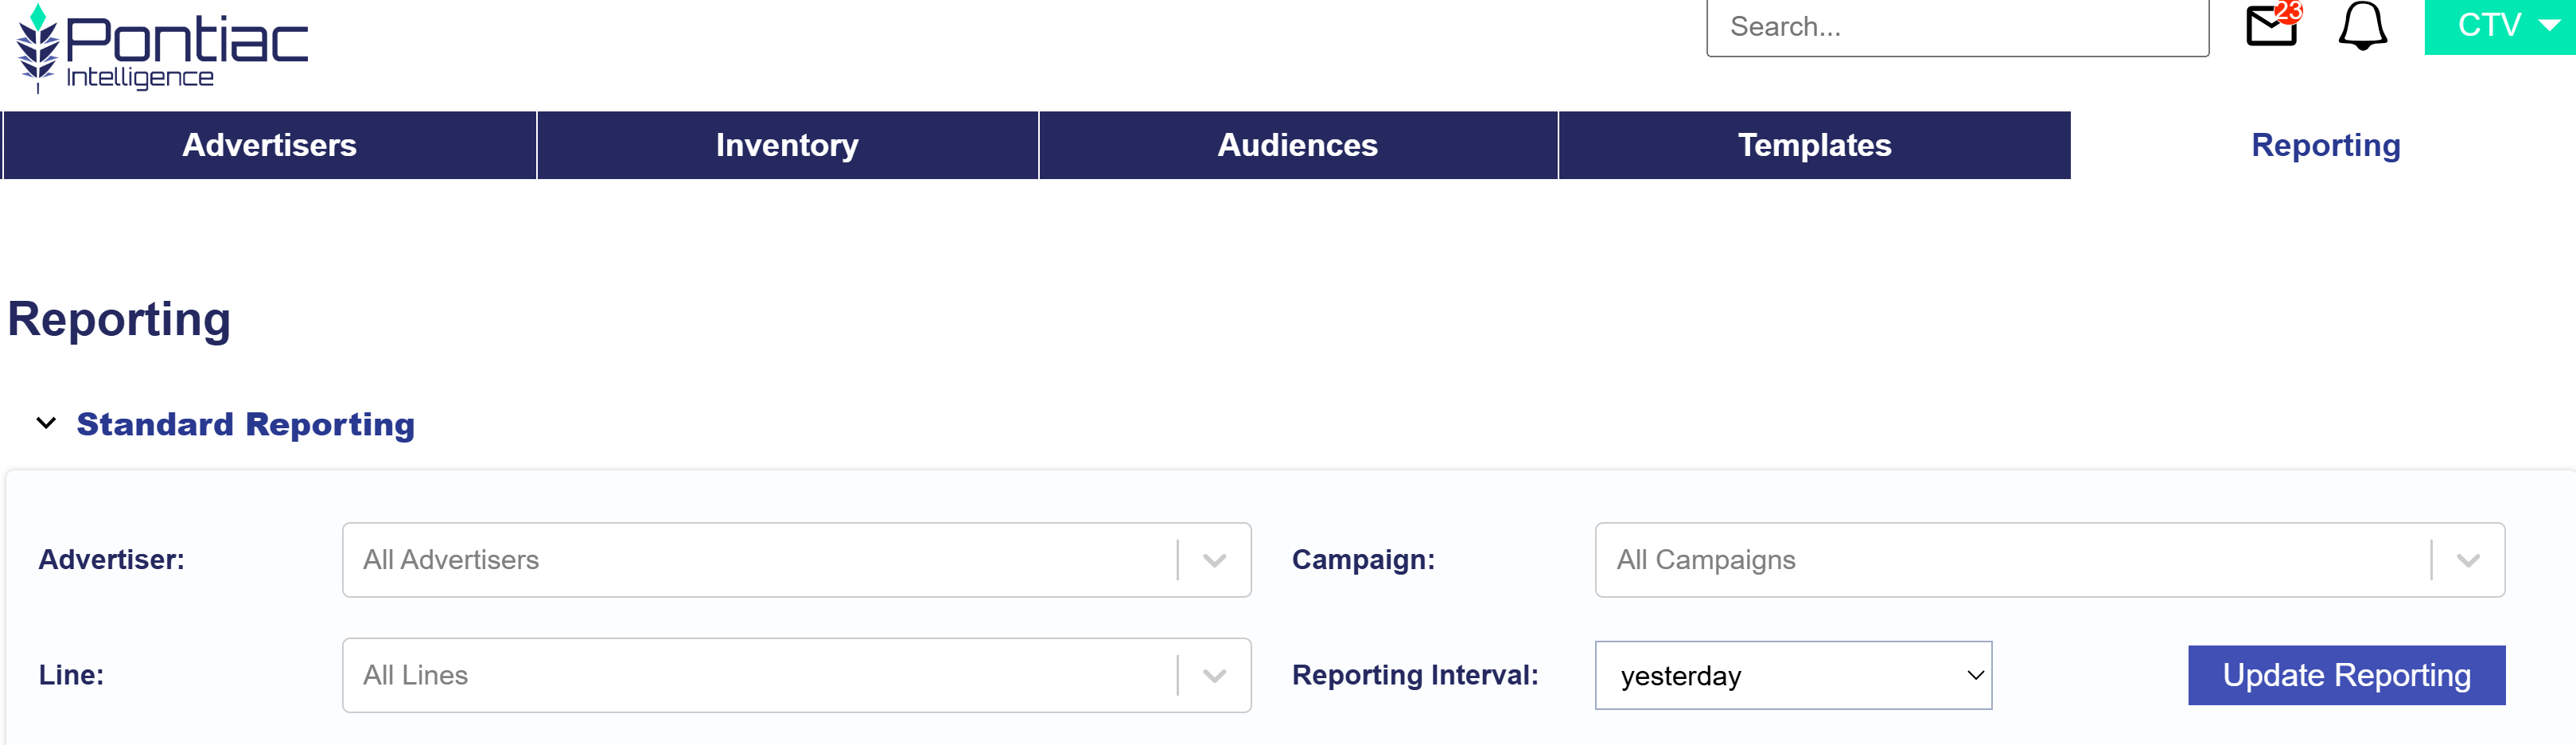
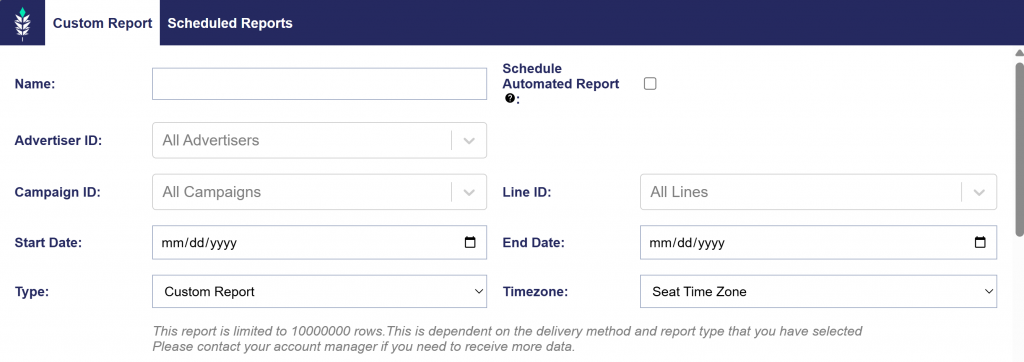
In the Reporting tab of the CTV platform, create a Standard Report by selecting the Advertisers, Campaigns, and Lines you want to analyze. This report provides summarized data and charts to help evaluate performance and identify key insights. The sections include:

  • Summary
  • Inventory
  • Creatives
  • Device Type
  • Foot Traffic
  • Geo

Continue to each section to learn more.

Summary

The summary section within Standard Reporting provides a high level glance of the selected Advertiser, Campaign, and Lines for the Reporting Interval. This section is broken into top tiles, two metrics comparison chart, a downloadable CSV file to conduct further analysis, Volume by Hour Heatmap, Pie charts, Transparency (% reported), and Video Events. Continue to read about each section.

Top Tiles

Note that all intervals with the exception of yesterday, include metrics from today. Today’s metrics update hourly and have a 3 hour delay. The metrics include:

  • Report Date: Shows the selected report date or date range.
  • Impressions: The total number of impressions the selected Advertiser, Campaign, and Lines served within the selected reporting interval.
  • Total Cost: The total amount of spend that the selected Advertiser, Campaign, and Lines spent, including media costs and any applicable margins or fees, within the selected reporting interval.
  • Total Cost CPM: The total cost per thousand impressions for the selected Advertiser, Campaign, and Lines within the selected reporting interval, calculated as (Total Cost / Impressions) x 1,000.
  • Revenue: The total amount of revenue generated by the selected Advertiser, Campaign, and Lines within the selected reporting interval.
  • Transparency Score: A score indicating the level of transparency in reporting and data availability.

Metric Comparison Chart

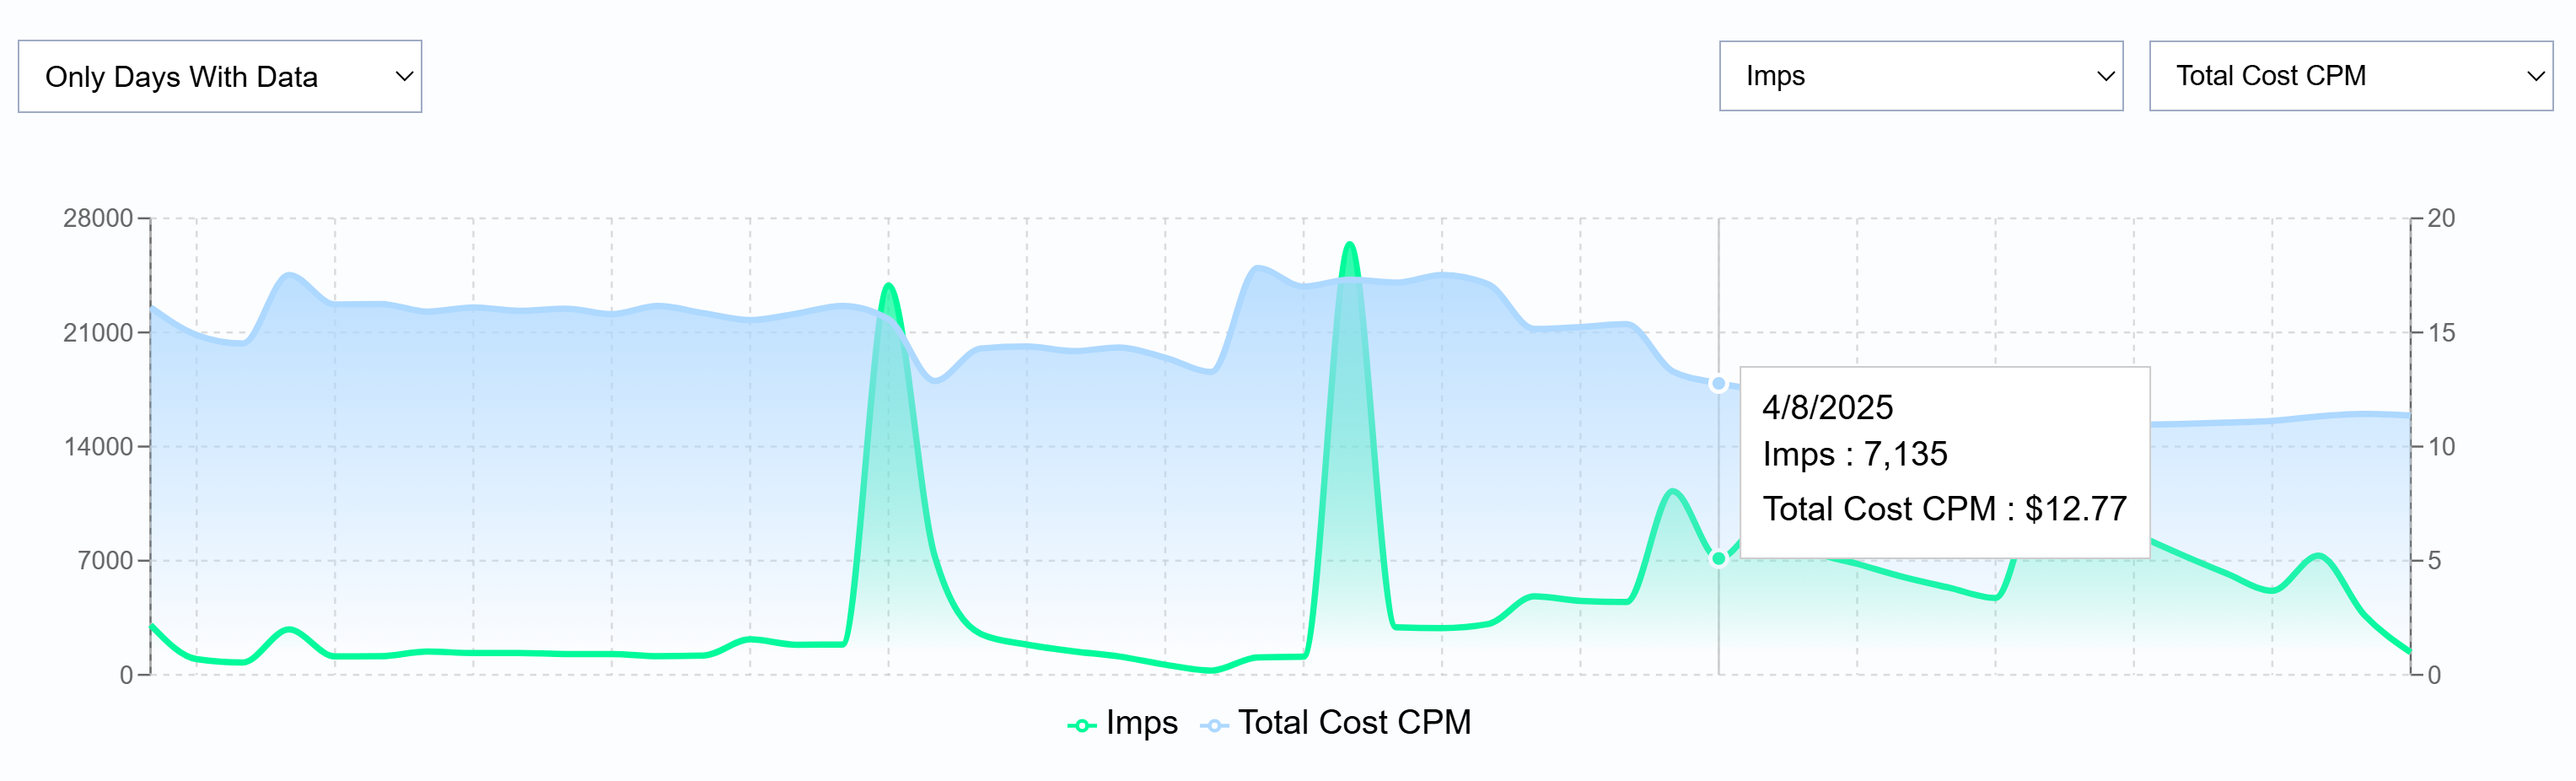
Filter for only days with data or all days and select and compare two metrics against each other. Select from the following metrics:

  • Imps: The total number of impressions served within the selected reporting interval.
  • Media Cost: The total dollar amount spent on the media before additional fees or margins are applied.
  • Total Cost: The total spend, including media costs and any applicable margins or fees.
  • Total Cost CPM: The total cost per thousand impressions, calculated as (Total Cost / Impressions) x 1,000.
  • Revenue: The total revenue generated from the selected reporting interval.
  • VCR: The percentage of video ad impressions that are played to completion.
  • IP Conversions: The number of conversions attributed to users who were served an ad and later converted based on IP tracking.
  • Foot Traffic ‘Attributed Visitors’: The number of users who visited a physical location after viewing an ad.

Downloadable Table

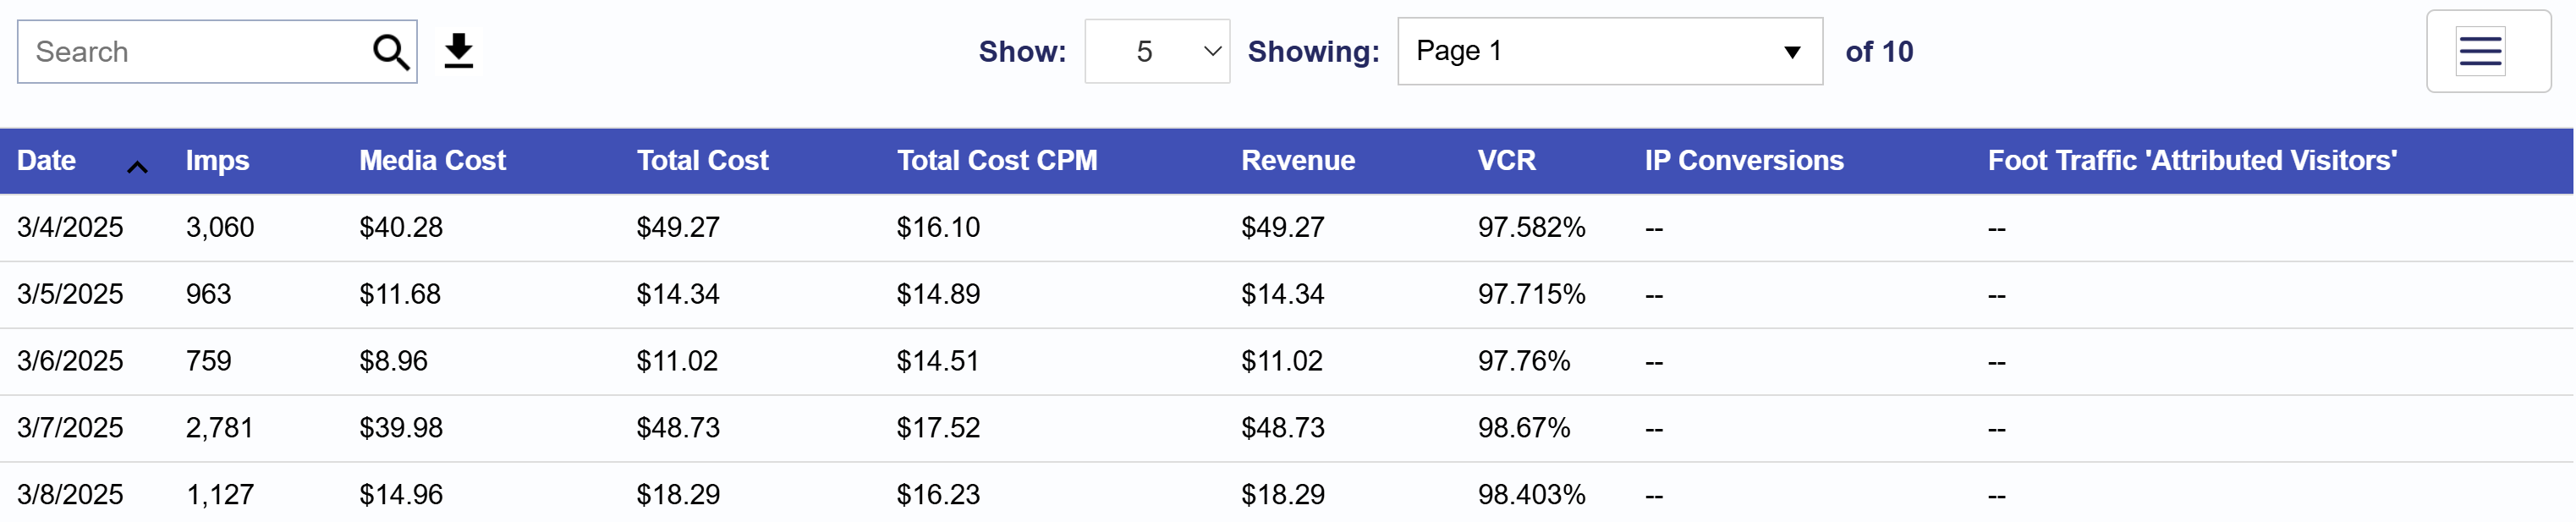
Below the chart, locate the search bar in the Table section. On the right-hand side of the search bar, click the download button to export the performance data as a CSV file. All metrics listed above are available for export. To customize the metrics included in the CSV file, click the three lines in the top right corner of the table and select or deselect the metrics that matter most to you.

Volume by Hour Heatmap

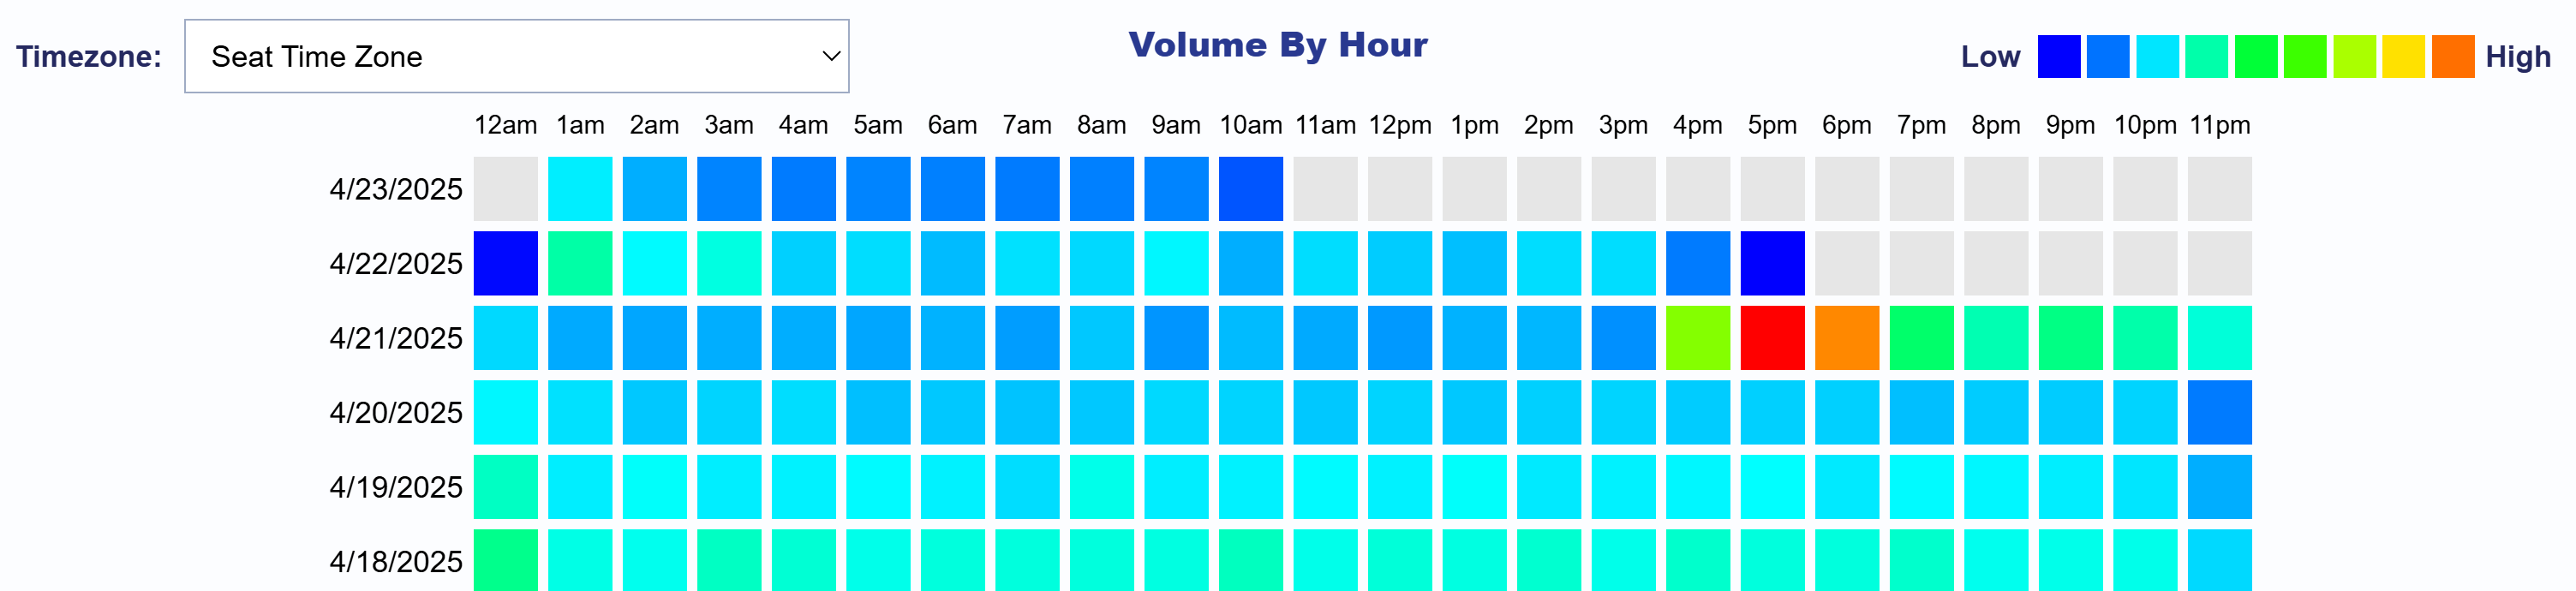
The Volume by Hour Heatmap allows you to explore activity patterns over time. By default, the heatmap is displayed using your Seat’s time zone, but you can filter for any time zone as needed. Use the color key in the top right corner to interpret volume levels from low to high. This visualization highlights hourly volume trends by date, making it easy to identify peak activity periods and uncover actionable insights. Hover over any cell to view the Total Cost for that specific date and hour. Use this heatmap to quickly detect spikes in volume, optimize dayparting strategies, or compare performance across time zones.

Pie Charts

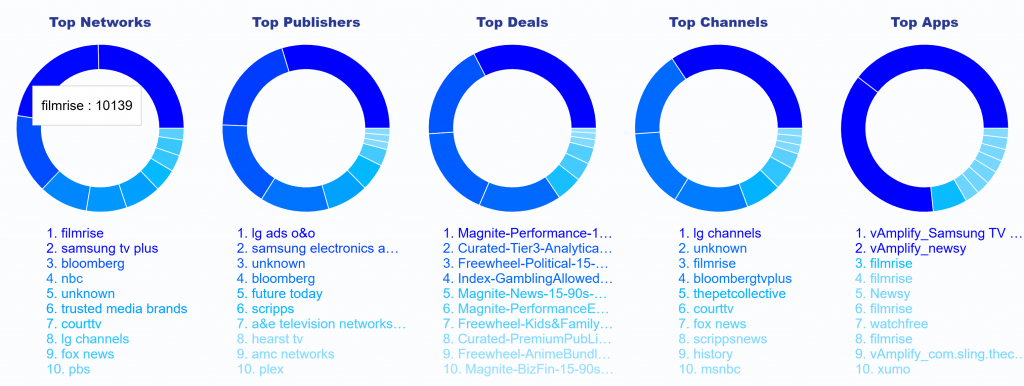
The Pie Charts section highlights the top 10 impression performers across key supply sources: Networks, Publishers, Deals, Channels, and Apps. This visualization offers a quick snapshot of which sources are driving the most impressions. When hovering over a segment in any pie chart, you’ll see displayed the name of the supply source and the number of impressions served, helping you quickly identify high performing supply sources.

Transparency (% reported)

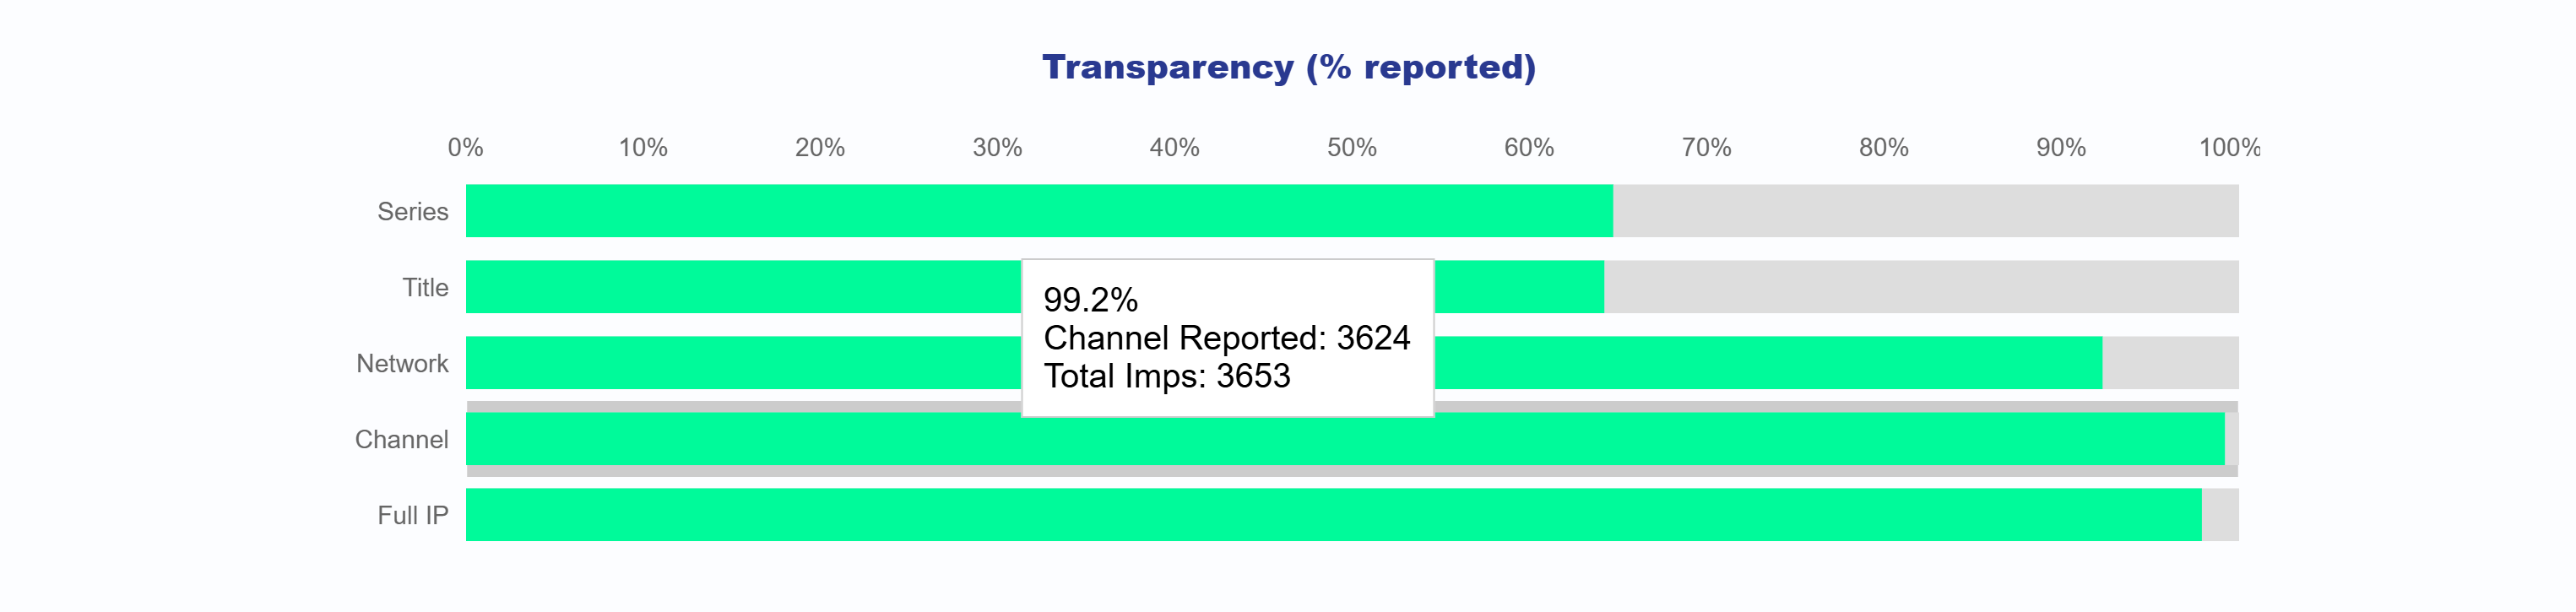
The Transparency Chart displays the reporting percentages for key inventory identifiers including Series, Title, Network, Channel, and Full IP. It helps users understand what portion of impressions include data for each category. For each identifier, the chart shows:

  • The percentage of impressions where the value was reported
  • The number of unique values reported
  • The total number of impressions associated with that category

This provides a clear view into the transparency of supply sources and helps identify areas where reporting may be limited.

Video Events

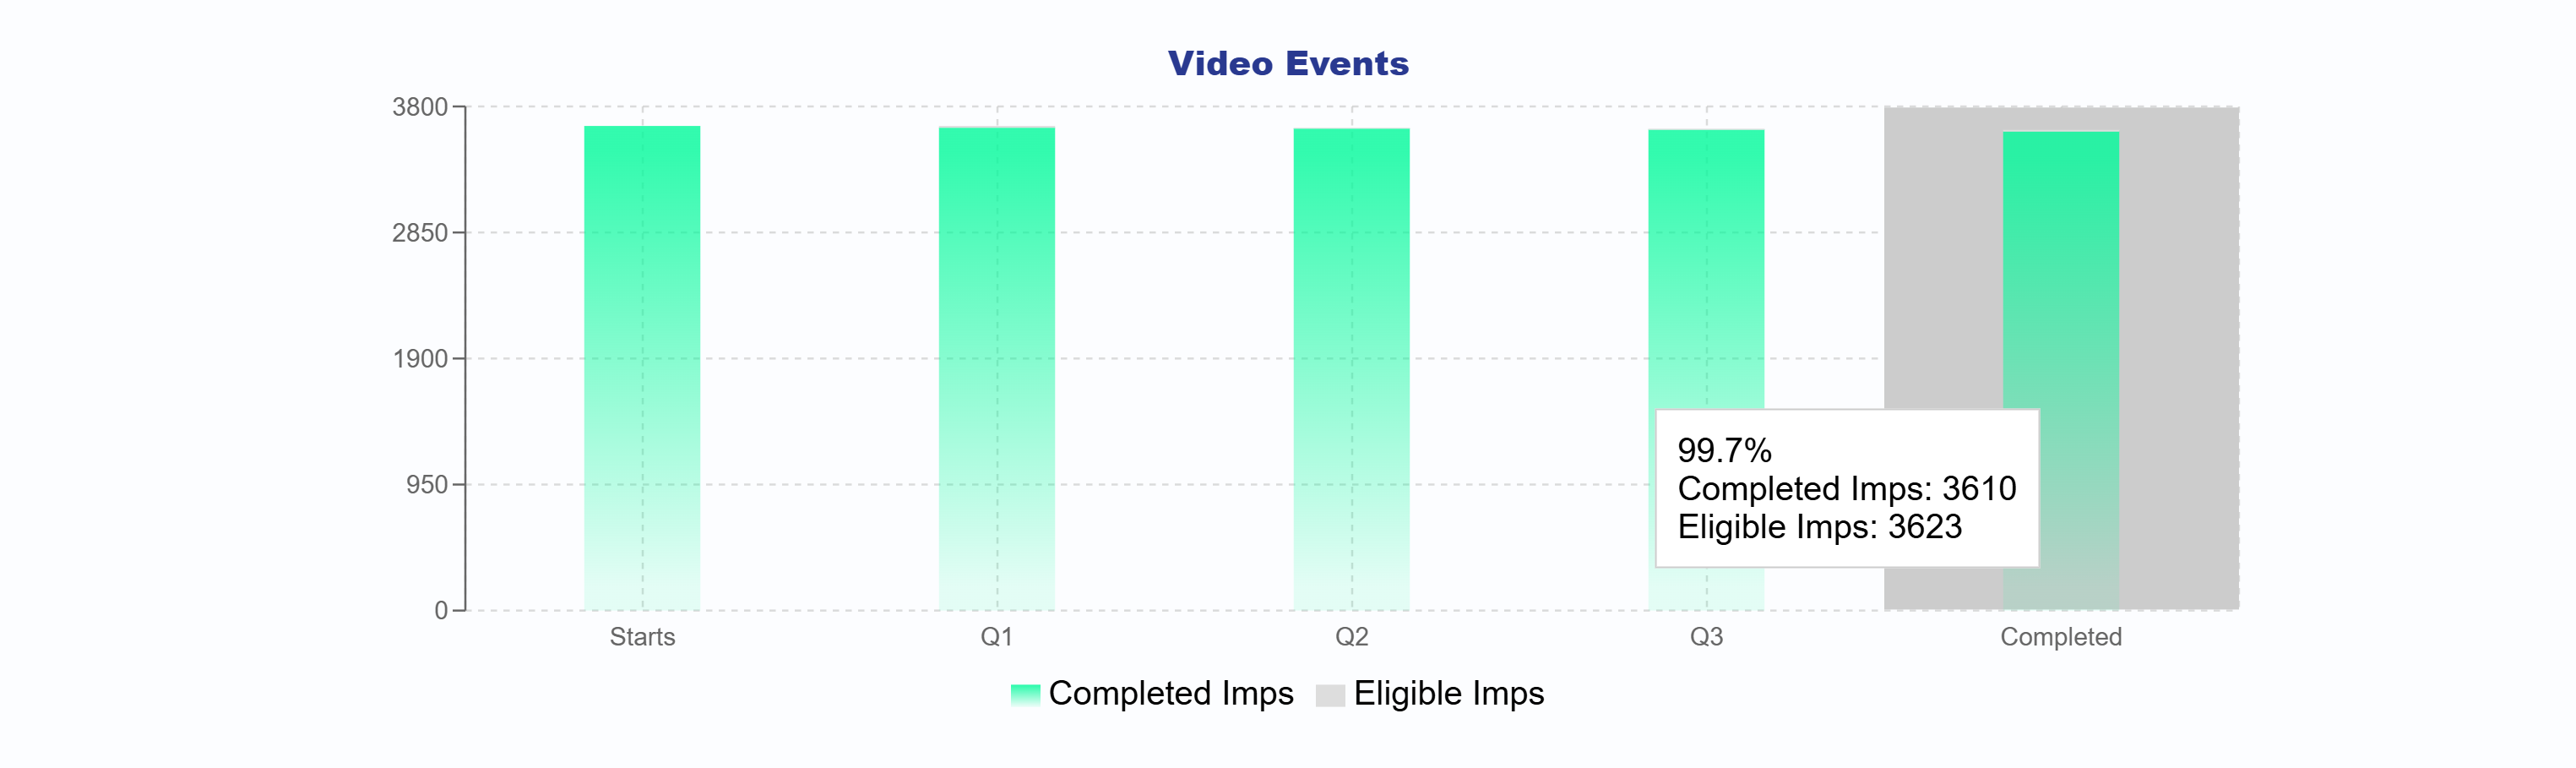
The Video Events bar chart illustrates each stage of the video playback journey from Start through Q1, Q2, Q3, to Complete. It offers a clear breakdown of how many impressions reached each milestone. You can compare your eligible impressions with your completed impressions to evaluate overall video performance and completion rates across your campaign.

Inventory

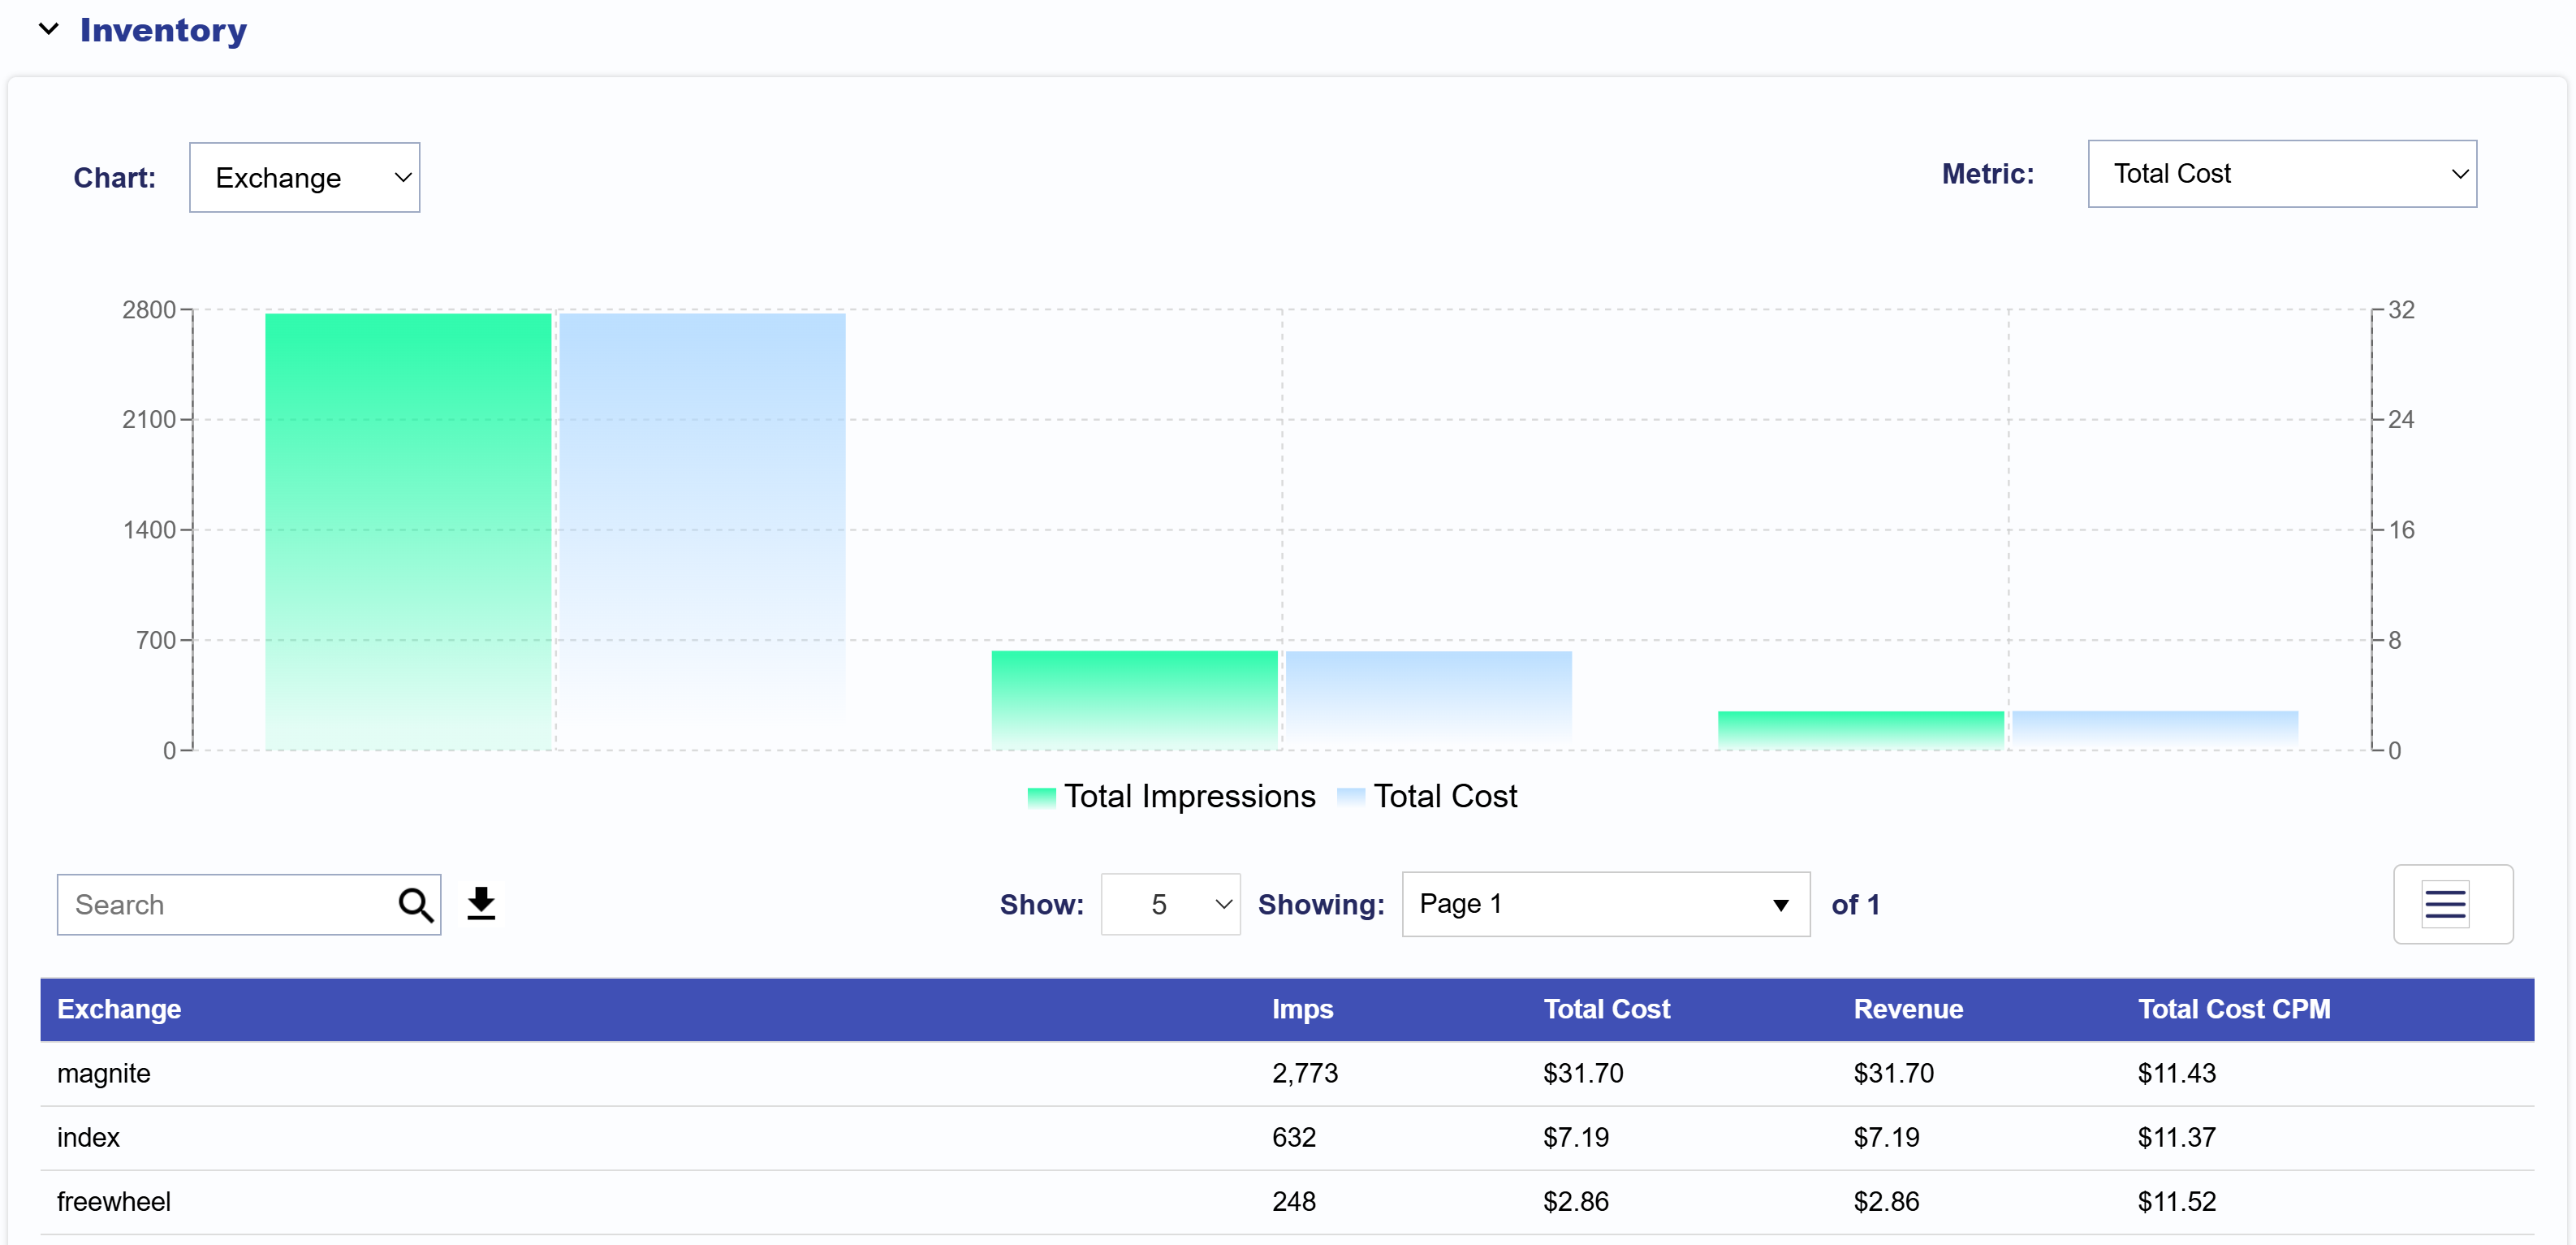
The Inventory dropdown section features both a chart and a table to help you analyze campaign performance by inventory source. The chart can be filtered by categories such as Site Domain, Exchange, Publisher, Series, Title, and Genre, and metrics such as Total Cost, Revenue, Total Cost CPM, and Transparency Score, offering flexible insight into impression and cost trends.

The bar chart displays the selected category and metric. Hover over each bar pair to view the Category Name, Total Impressions, and Total Cost. To adjust how many are shown, use the Show: dropdown to display 5, 10, 25, 50, or 100 results.

To export data, go to the Table section. On the right side of the search bar, click the download icon to export the table as a CSV file. All metrics mentioned above are included as well as impressions. To customize the export, click the three line icon in the top right of the table to select or deselect the metrics most relevant to your analysis.

Creatives

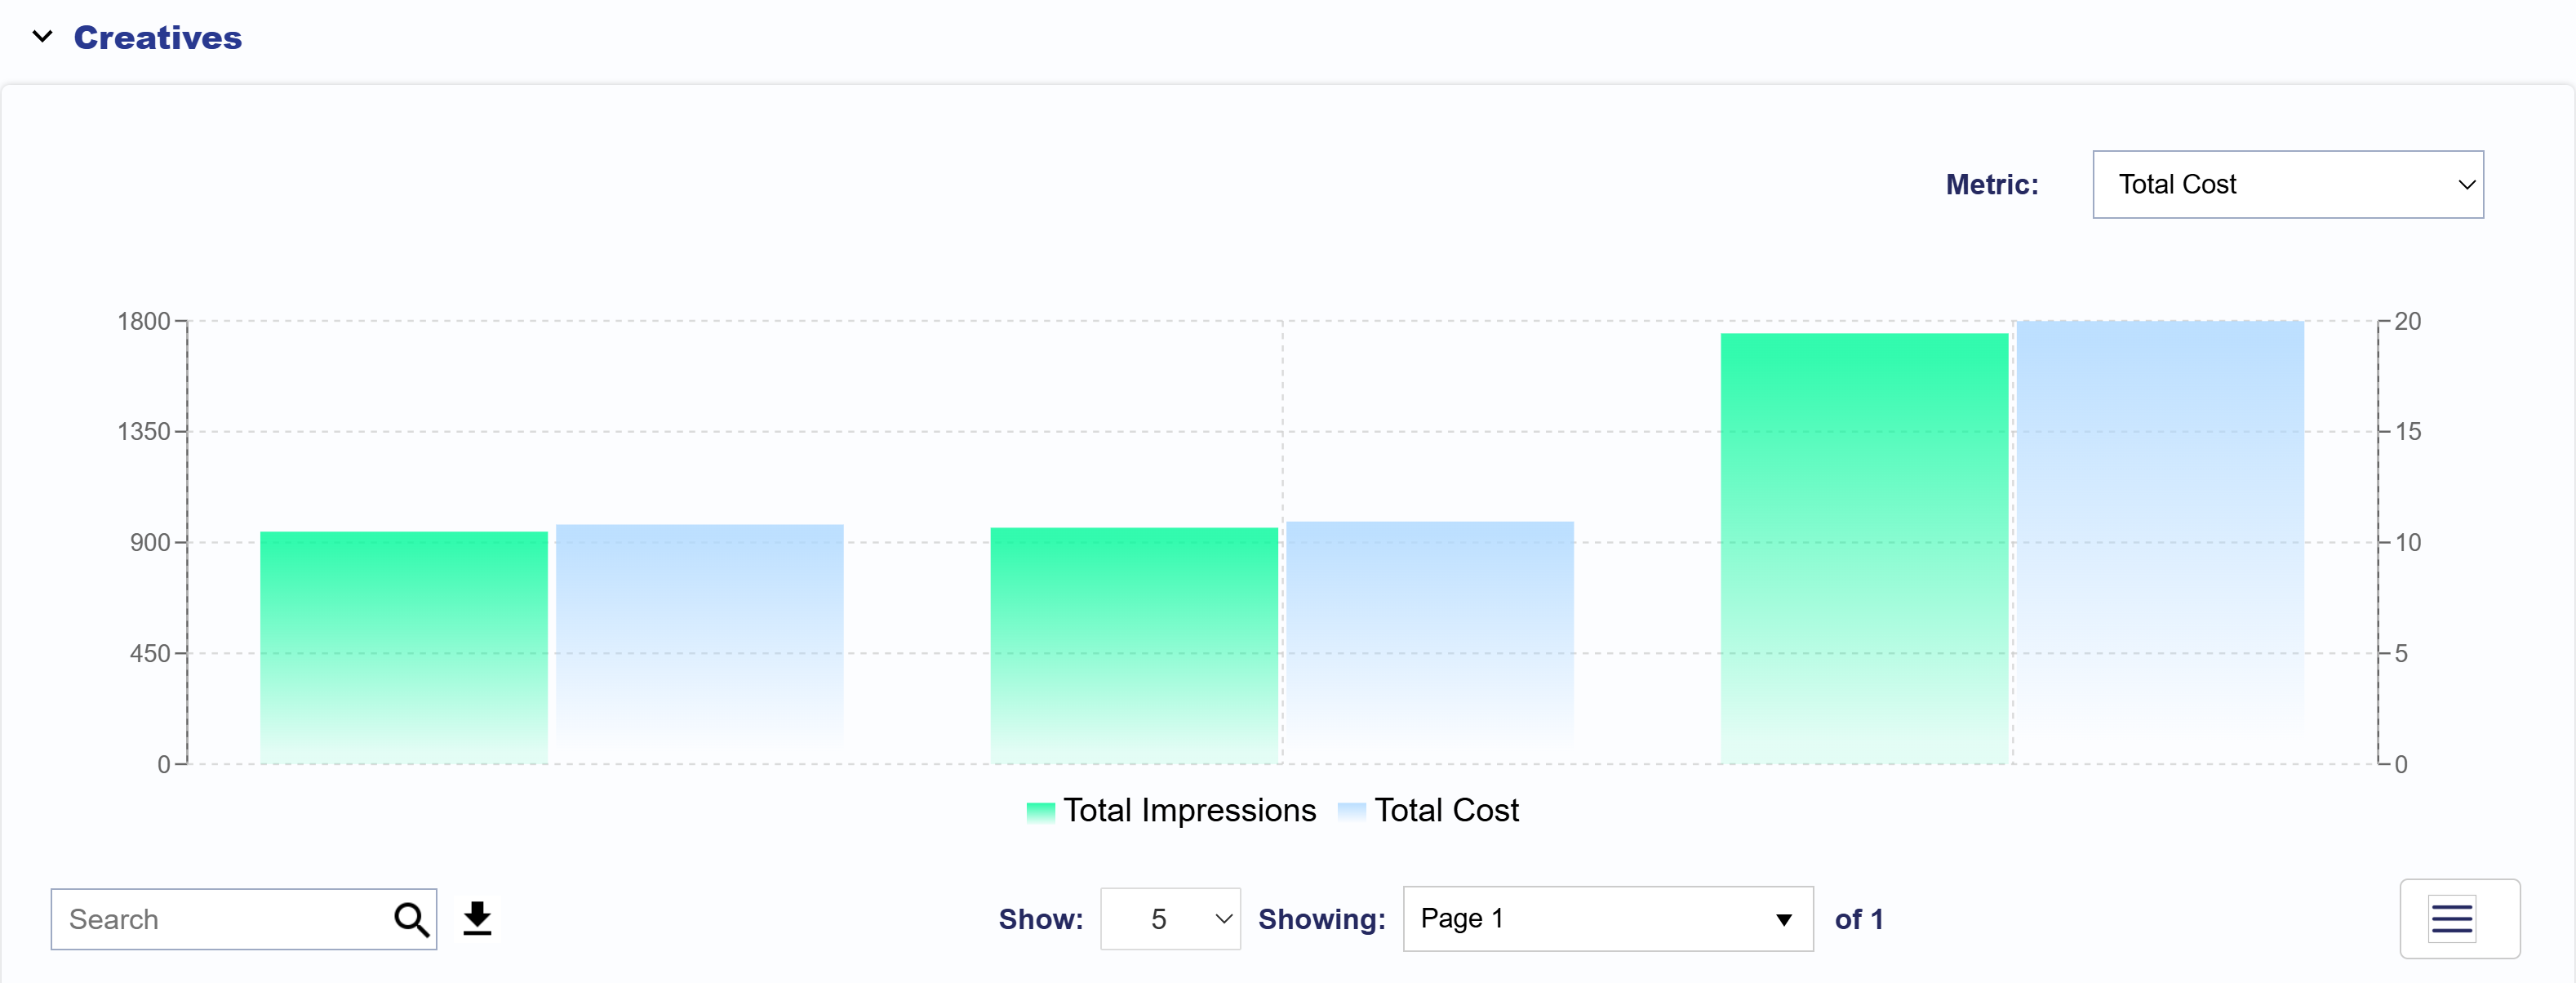
The Creatives section displays Total Cost and Impressions for each creative associated with the selected Advertiser, Campaign, and Lines in the top filter section, based on the selected reporting interval. The left Y-axis shows Impression counts, while the right Y-axis shows Total Cost, helping you compare delivery and spend across creatives at a glance.

You can adjust the metric compared to Total Impressions to show Total Cost, Revenue, Total Cost CPM, or Completion Rate for more customized analysis.

To export this data, scroll down to the Table section below the chart. On the right side of the search bar, click the download icon to export the table as a CSV file. You can further customize your export by clicking the three line icon in the top right corner of the table to select or deselect the metrics that are most relevant to your analysis.

Below are the available metric:

  • Creative ID: The unique ID assigned to your creative.
  • Name: The name of the creative.
  • Imps: The total number of impressions the creative served.
  • Total Cost: The total spend attributed to the creative.
  • Revenue: The revenue generated by the creative.
  • Total Cost CPM: The cost per thousand impressions (CPM).
  • Completion Rate: The percentage of impressions that completed the full video.

Device Type

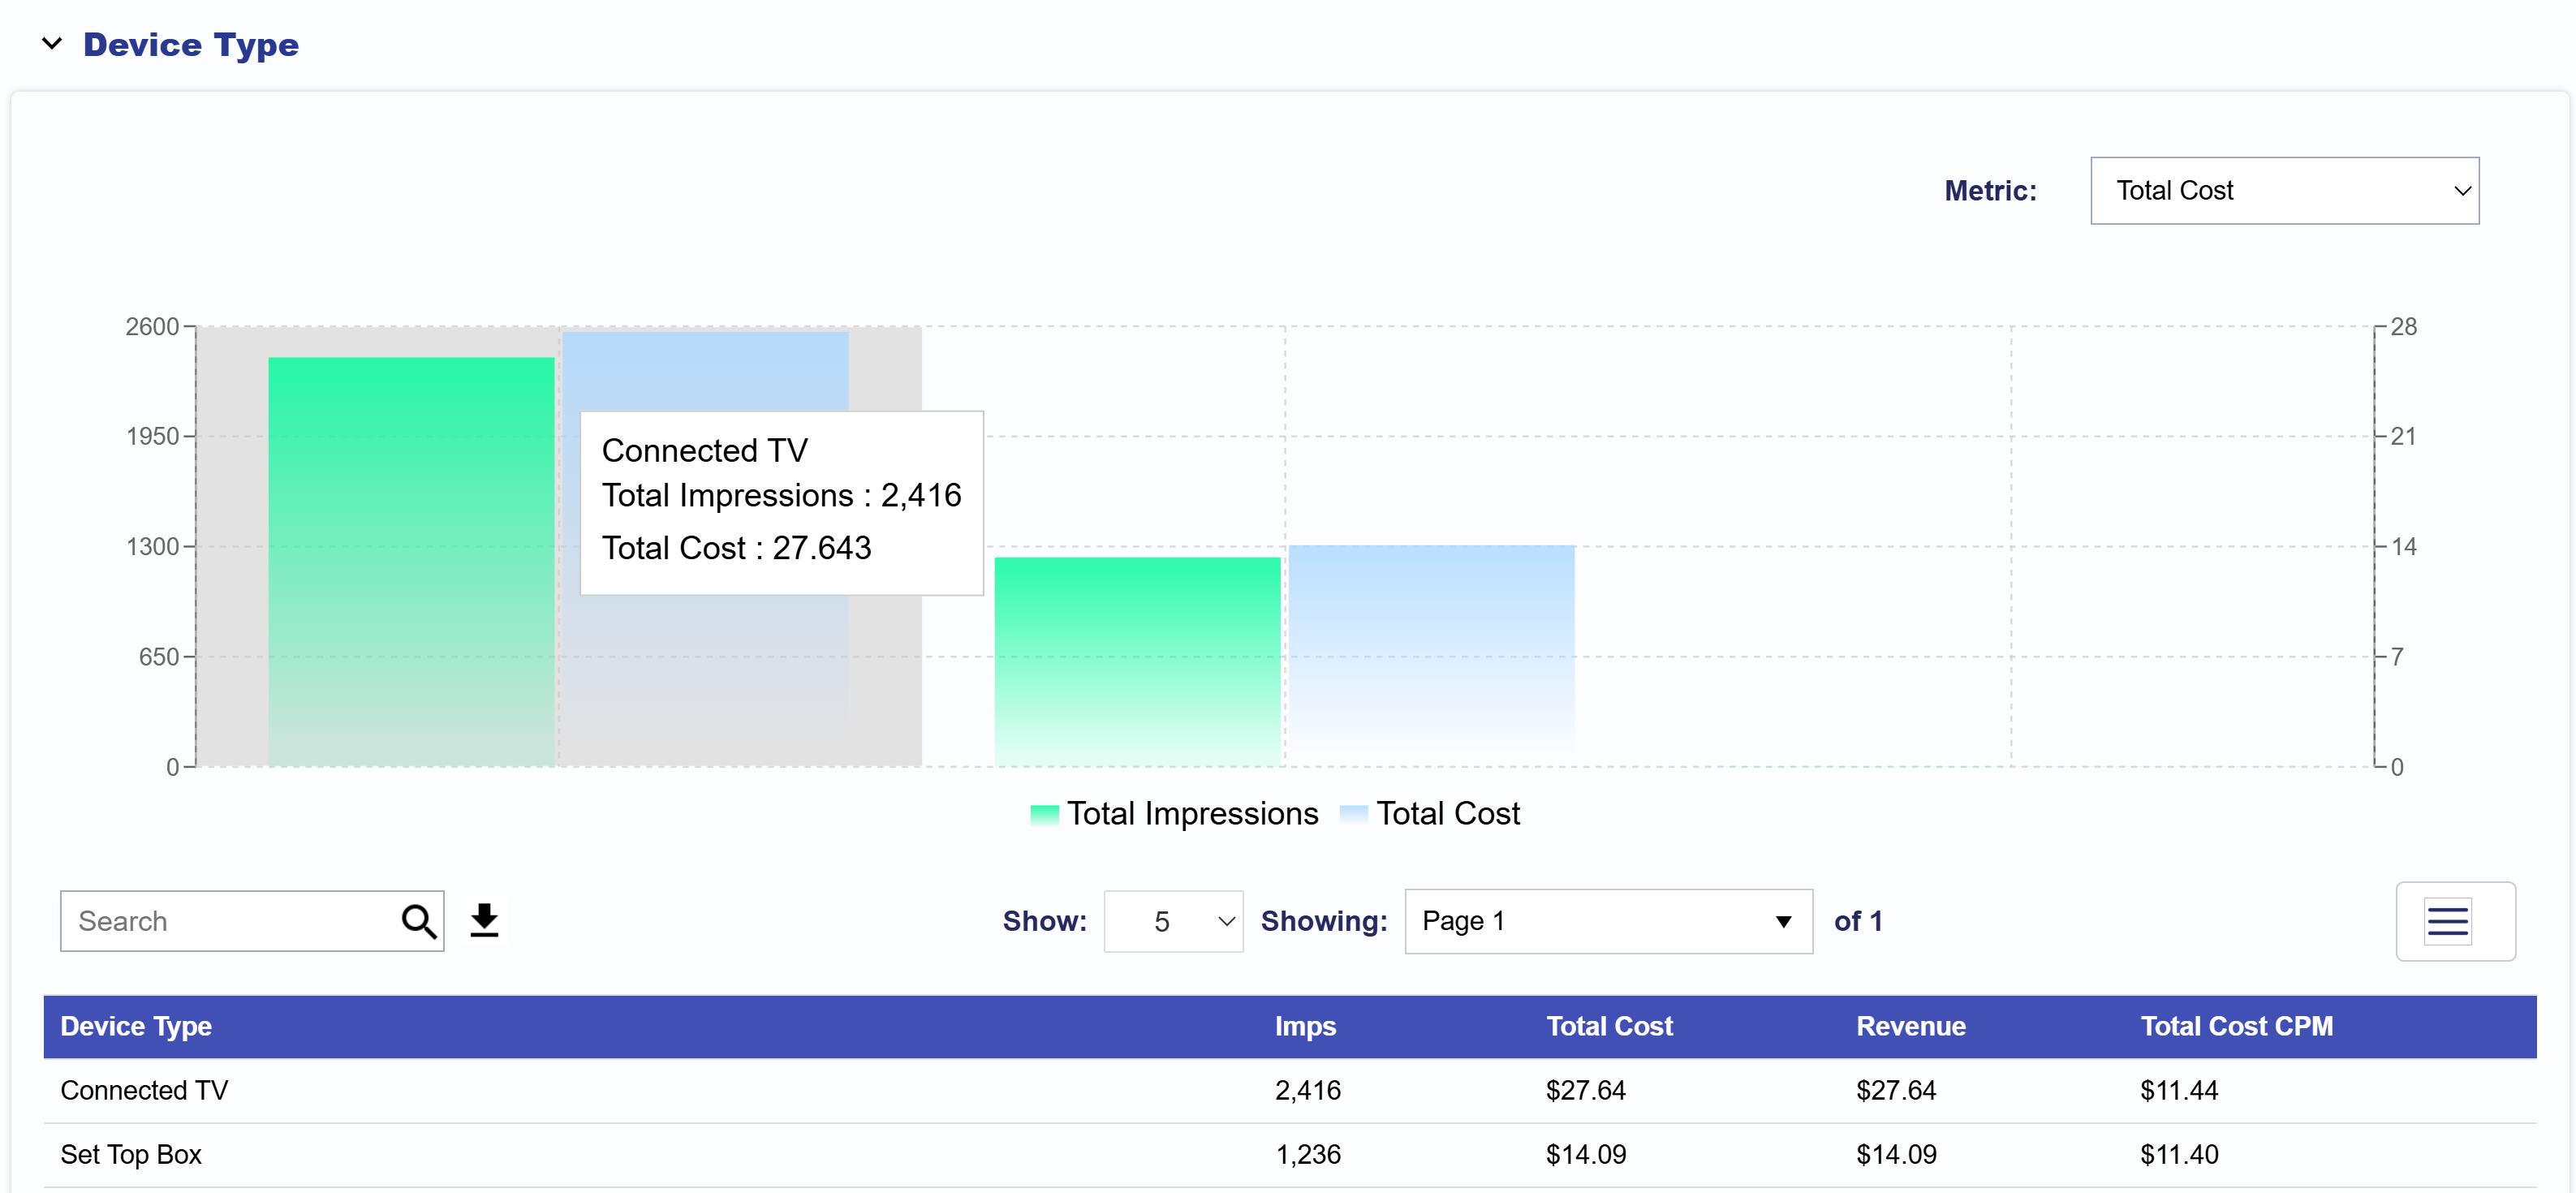
The Device Type section displays Total Cost and Impressions for each device type associated with the selected Advertiser, Campaign, and Lines in the top filter section, based on the selected reporting interval. The data is broken down by device type, allowing you to compare performance across different devices. The left Y-axis shows Impression counts, while the right Y-axis shows Total Cost, helping you easily compare delivery and spend across devices at a glance.

You can adjust the metric compared to Total Impressions to show Total Cost, Revenue, or Total Cost CPM for more customized analysis.

To export this data, scroll down to the Table section below the chart. On the right side of the search bar, click the Download icon to export the table as a CSV file. You can further customize your export by clicking the three line icon in the top right corner of the table to select or deselect the metrics that are most relevant to your analysis.

  • Device Type: The name of the device type.
  • Imps: The total number of impressions served by each device type.
  • Total Cost: The total spend attributed to each device type.
  • Revenue: The revenue generated by each device type.
  • Total Cost CPM: The cost per thousand impressions (CPM) for each device type.

Network

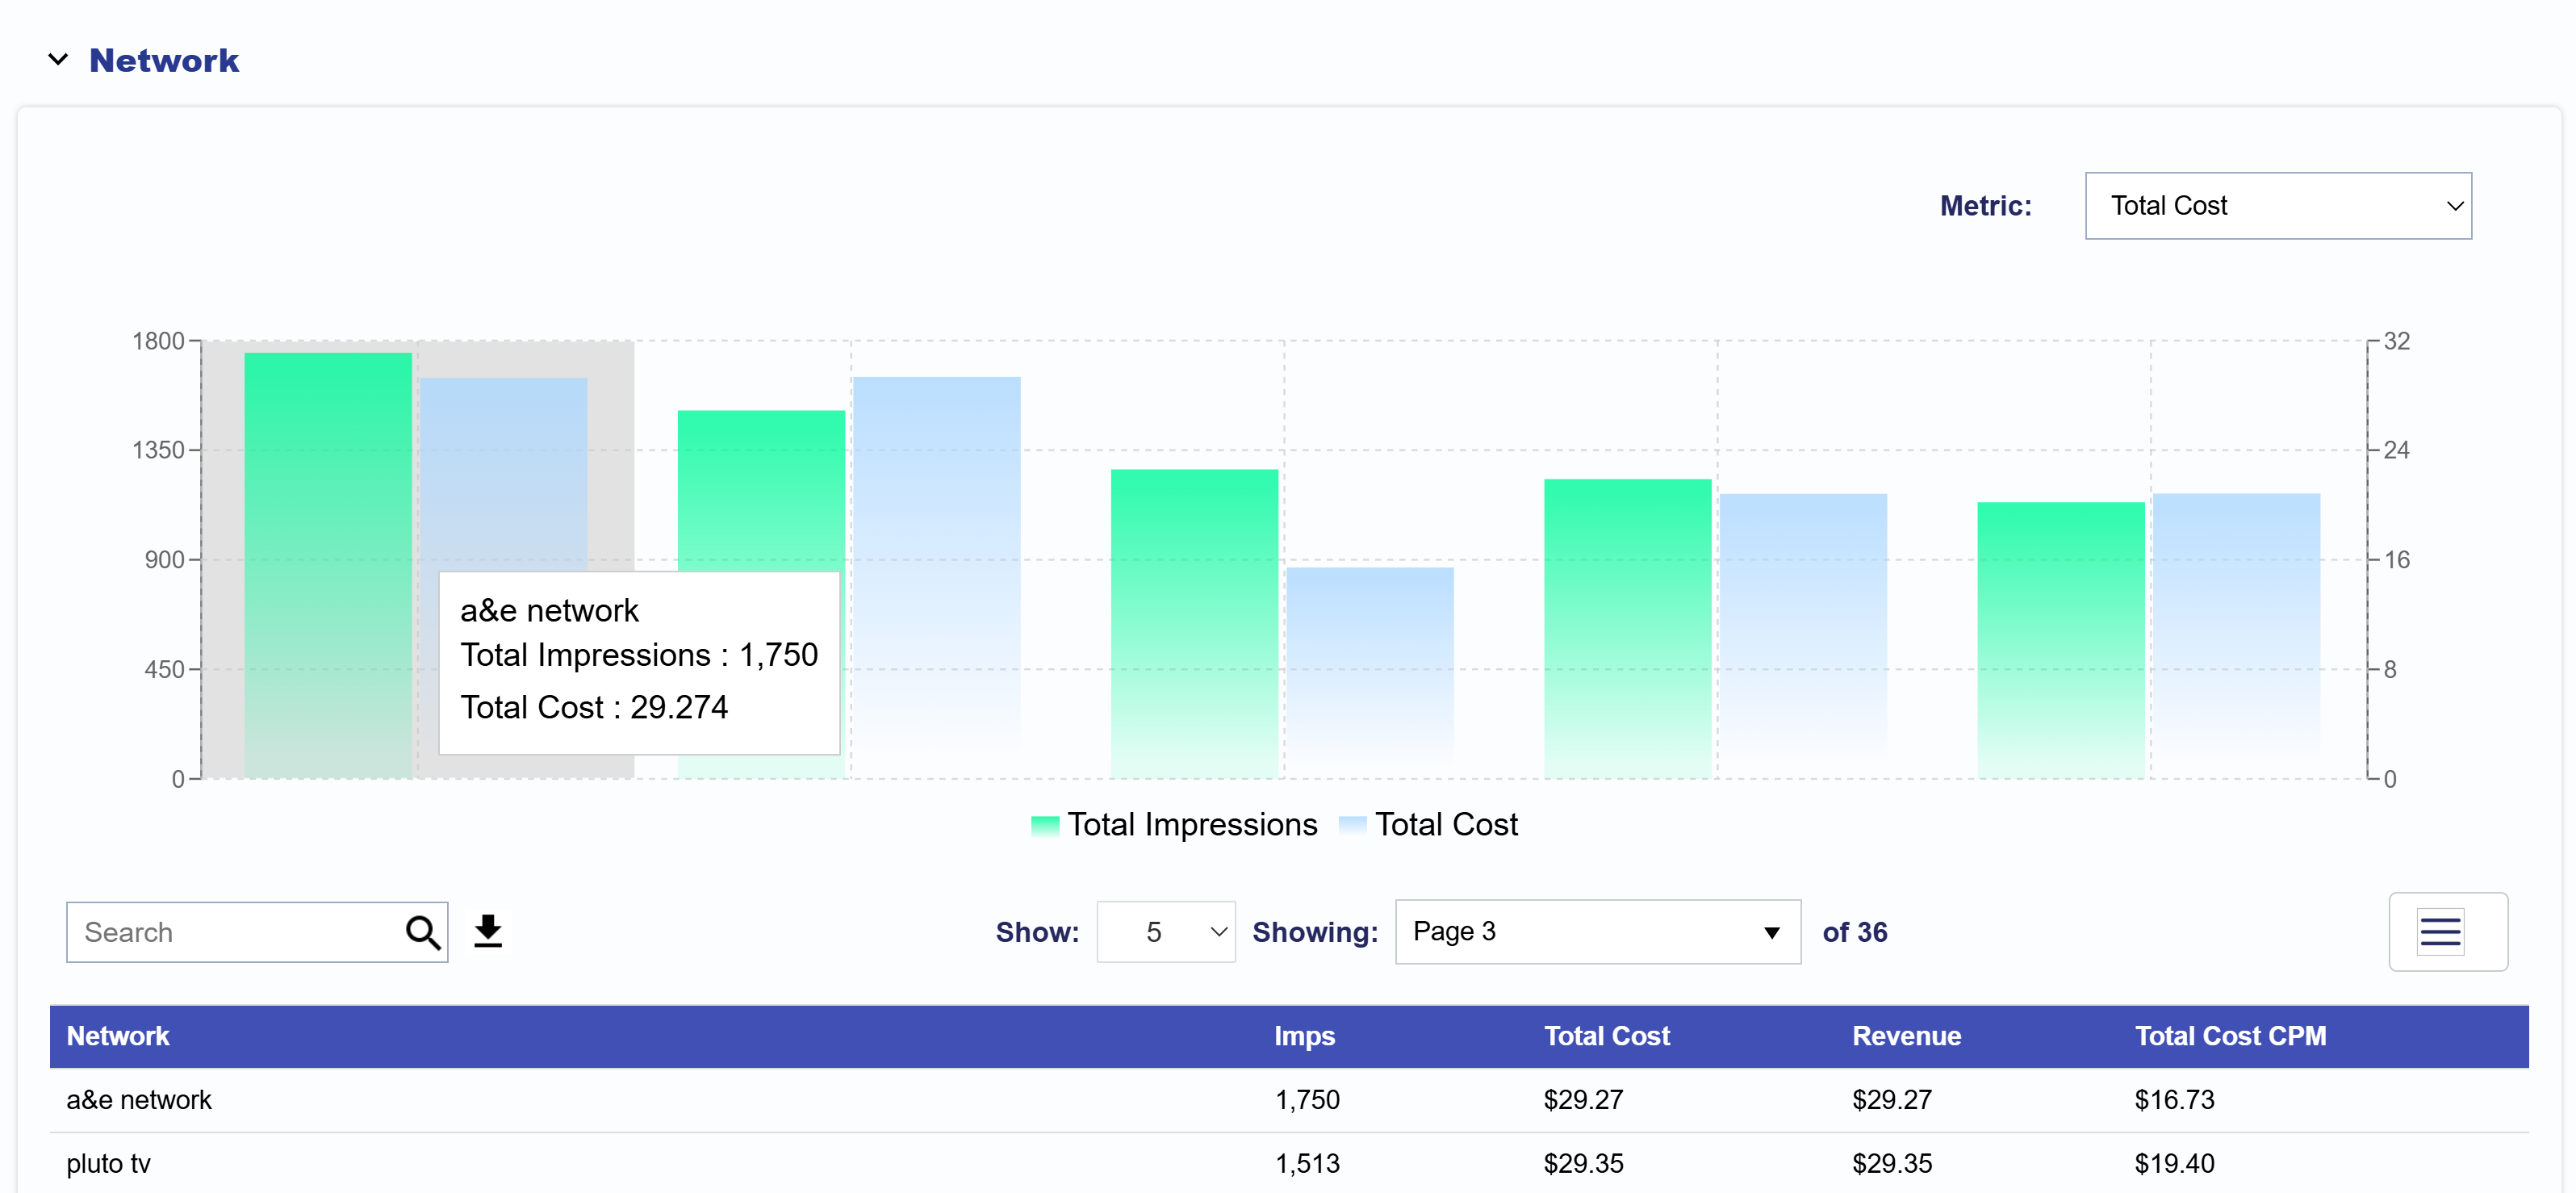
The Network section displays Total Cost and Impressions for each network associated with the selected Advertiser, Campaign, and Lines in the top filter section, based on the selected reporting interval. The data is broken down by network, allowing you to compare performance across different inventory sources. The left Y-axis shows Impression counts, while the right Y-axis shows Total Cost, making it easy to compare delivery and spend across networks at a glance.

You can adjust the metric compared to Total Impressions to show Total Cost, Revenue, or Total Cost CPM for more customized analysis.

To export this data, scroll down to the Table section below the chart. On the right side of the search bar, click the Download icon to export the table as a CSV file. You can further customize your export by clicking the three-line icon in the top right corner of the table to select or deselect the metrics most relevant to your analysis.

  • Network: The name of the network.
  • Imps: The total number of impressions served by each network.
  • Total Cost: The total spend attributed to each network.
  • Revenue: The revenue generated by each network.
  • Total Cost CPM: The cost per thousand impressions (CPM) for each network.

Deal

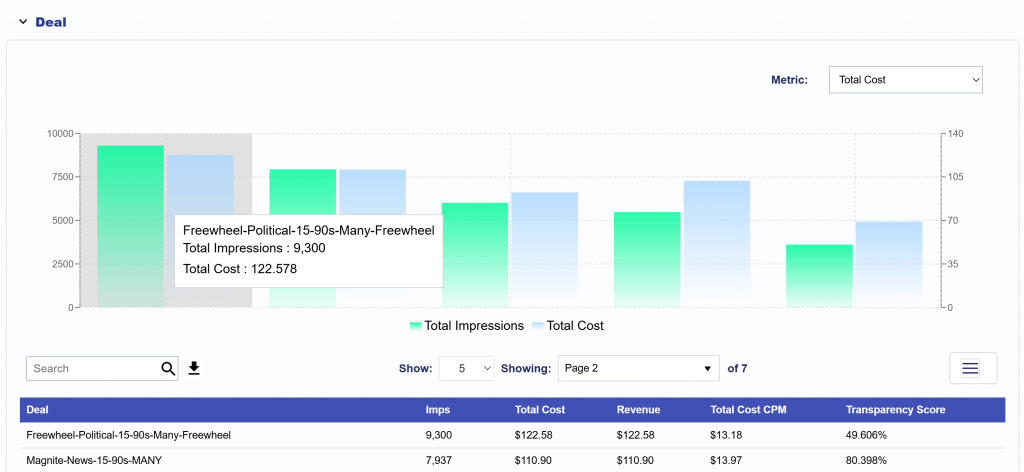
The Deal section displays a chosen metric and Impressions for each deal associated with the selected Advertiser, Campaign, and Lines in the top filter section, based on the selected reporting interval. The data is broken down by deal, allowing you to compare performance across different deals. The left Y-axis shows Impression counts, while the right Y-axis shows your chosen metric, making it easy to compare delivery and spend across deals at a glance.

You can adjust the metric compared to Total Impressions to show Total Cost, Revenue, Total Cost CPM, or Transparency Score for more customized analysis.

To export this data, scroll down to the Table section below the chart. On the right side of the search bar, click the Download icon to export the table as a CSV file. You can further customize your export by clicking the three-line icon in the top right corner of the table to select or deselect the metrics that are most relevant to your analysis.

  • Deal: The name of the deal.
  • Imps: The total number of impressions served by each deal.
  • Total Cost: The total spend attributed to each deal.
  • Revenue: The revenue generated by each deal.
  • Total Cost CPM: The cost per thousand impressions (CPM) for each deal.
  • Transparency Score: The score indicating the transparency level of the deal.

Channel

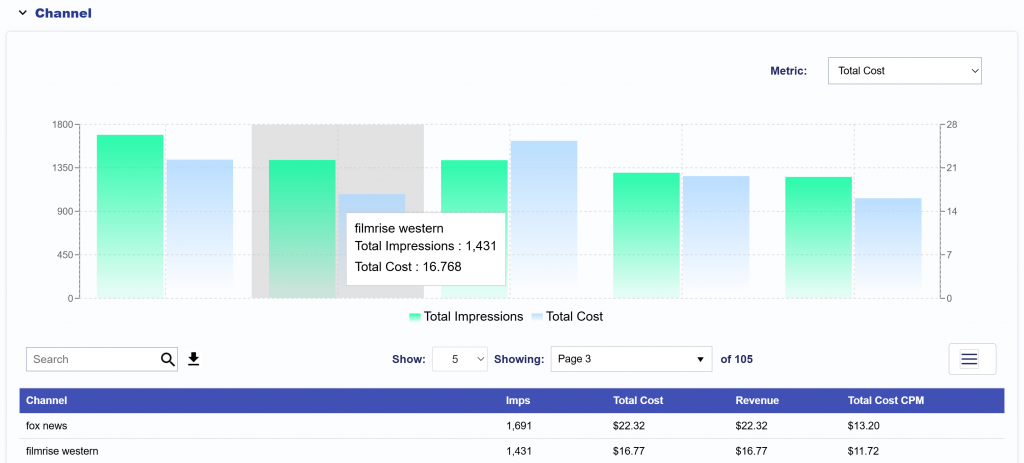
The Channel section displays a chosen metric and Impressions for each channel associated with the selected Advertiser, Campaign, and Lines in the top filter section, based on the selected reporting interval. The data is broken down by channel, allowing you to compare performance across different channels. The left Y-axis shows Impression counts, while the right Y-axis shows your chosen metric, making it easy to compare delivery and spend across channels at a glance.

You can adjust the metric compared to Total Impressions to show Total Cost, Revenue, or Total Cost CPM for more customized analysis.

To export this data, scroll down to the Table section below the chart. On the right side of the search bar, click the Download icon to export the table as a CSV file. You can further customize your export by clicking the three-line icon in the top right corner of the table to select or deselect the metrics that are most relevant to your analysis.

  • Channel: The name of the channel.
  • Imps: The total number of impressions served by each channel.
  • Total Cost: The total spend attributed to each channel.
  • Revenue: The revenue generated by each channel.
  • Total Cost CPM: The cost per thousand impressions (CPM) for each channel.

App

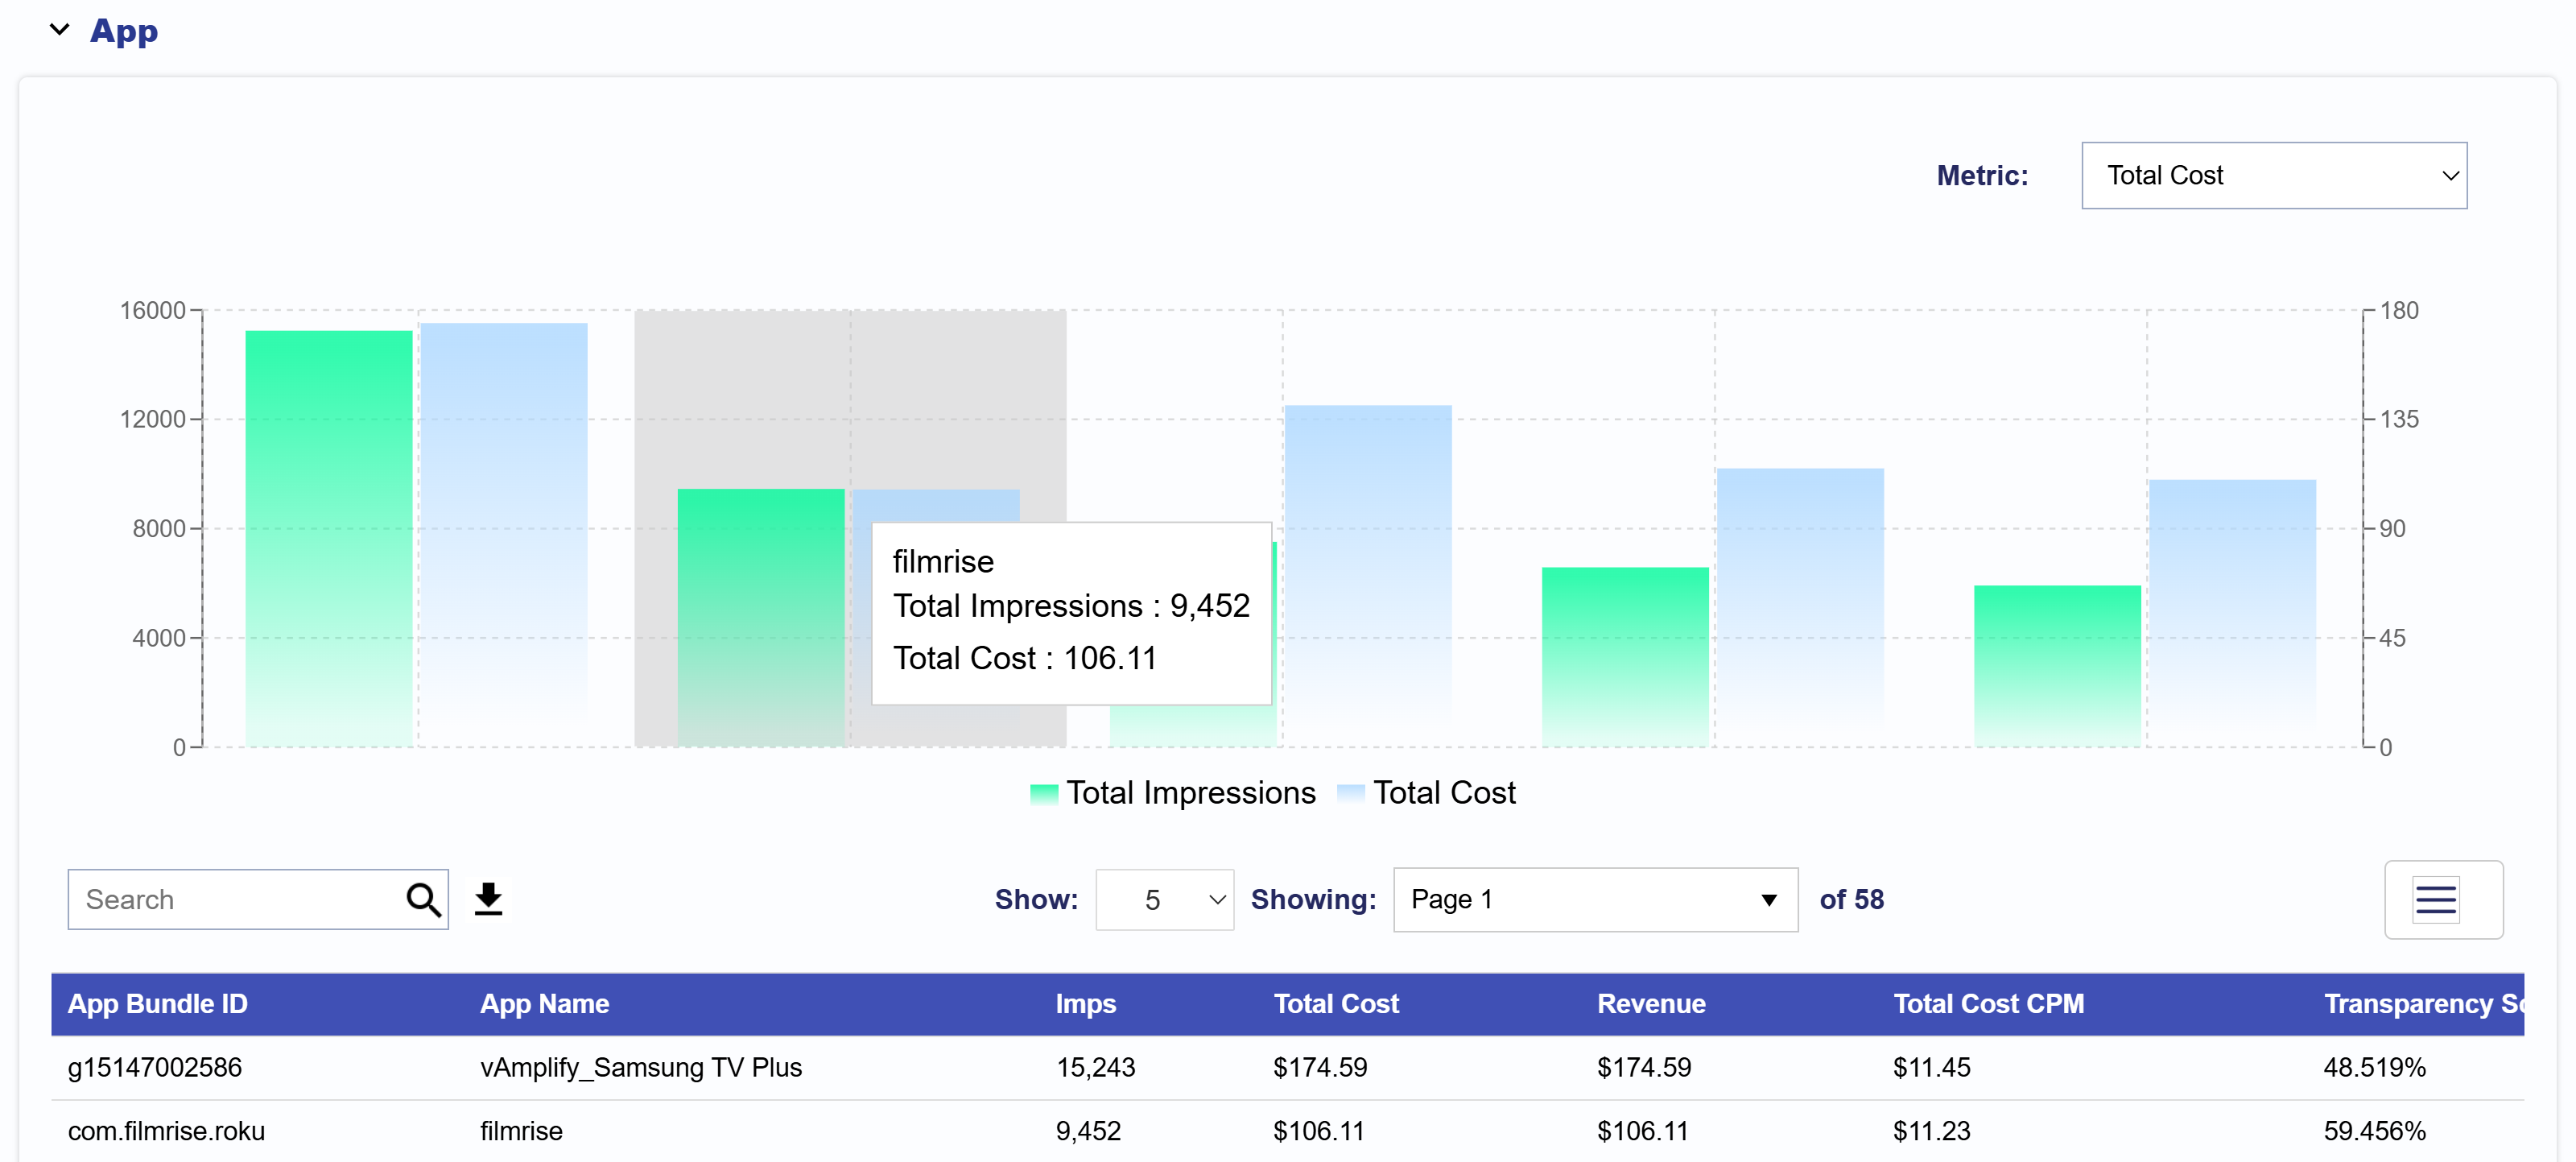
The App section displays a chosen metric and Impressions for each app associated with the selected Advertiser, Campaign, and Lines in the top filter section, based on the selected reporting interval. The data is broken down by app, allowing you to compare performance across different apps. The left Y-axis shows Impression counts, while the right Y-axis shows your chosen metric, making it easy to compare delivery and spend across apps at a glance.

You can adjust the metric compared to Total Impressions to show Total Cost, Revenue, Total Cost CPM, Completion Rate, or Transparency Score for more customized analysis.

To export this data, scroll down to the Table section below the chart. On the right side of the search bar, click the Download icon to export the table as a CSV file. You can further customize your export by clicking the three-line icon in the top right corner of the table to select or deselect the metrics that are most relevant to your analysis.

  • App: The name of the App.
  • Imps: The total number of impressions served by each App.
  • Total Cost: The total spend attributed to each App.
  • Revenue: The revenue generated by each App.
  • Total Cost CPM: The cost per thousand impressions (CPM) for each App.
  • Transparency Score: A score indicating the transparency level of the App, helping assess the clarity of supply source information and ad placement.
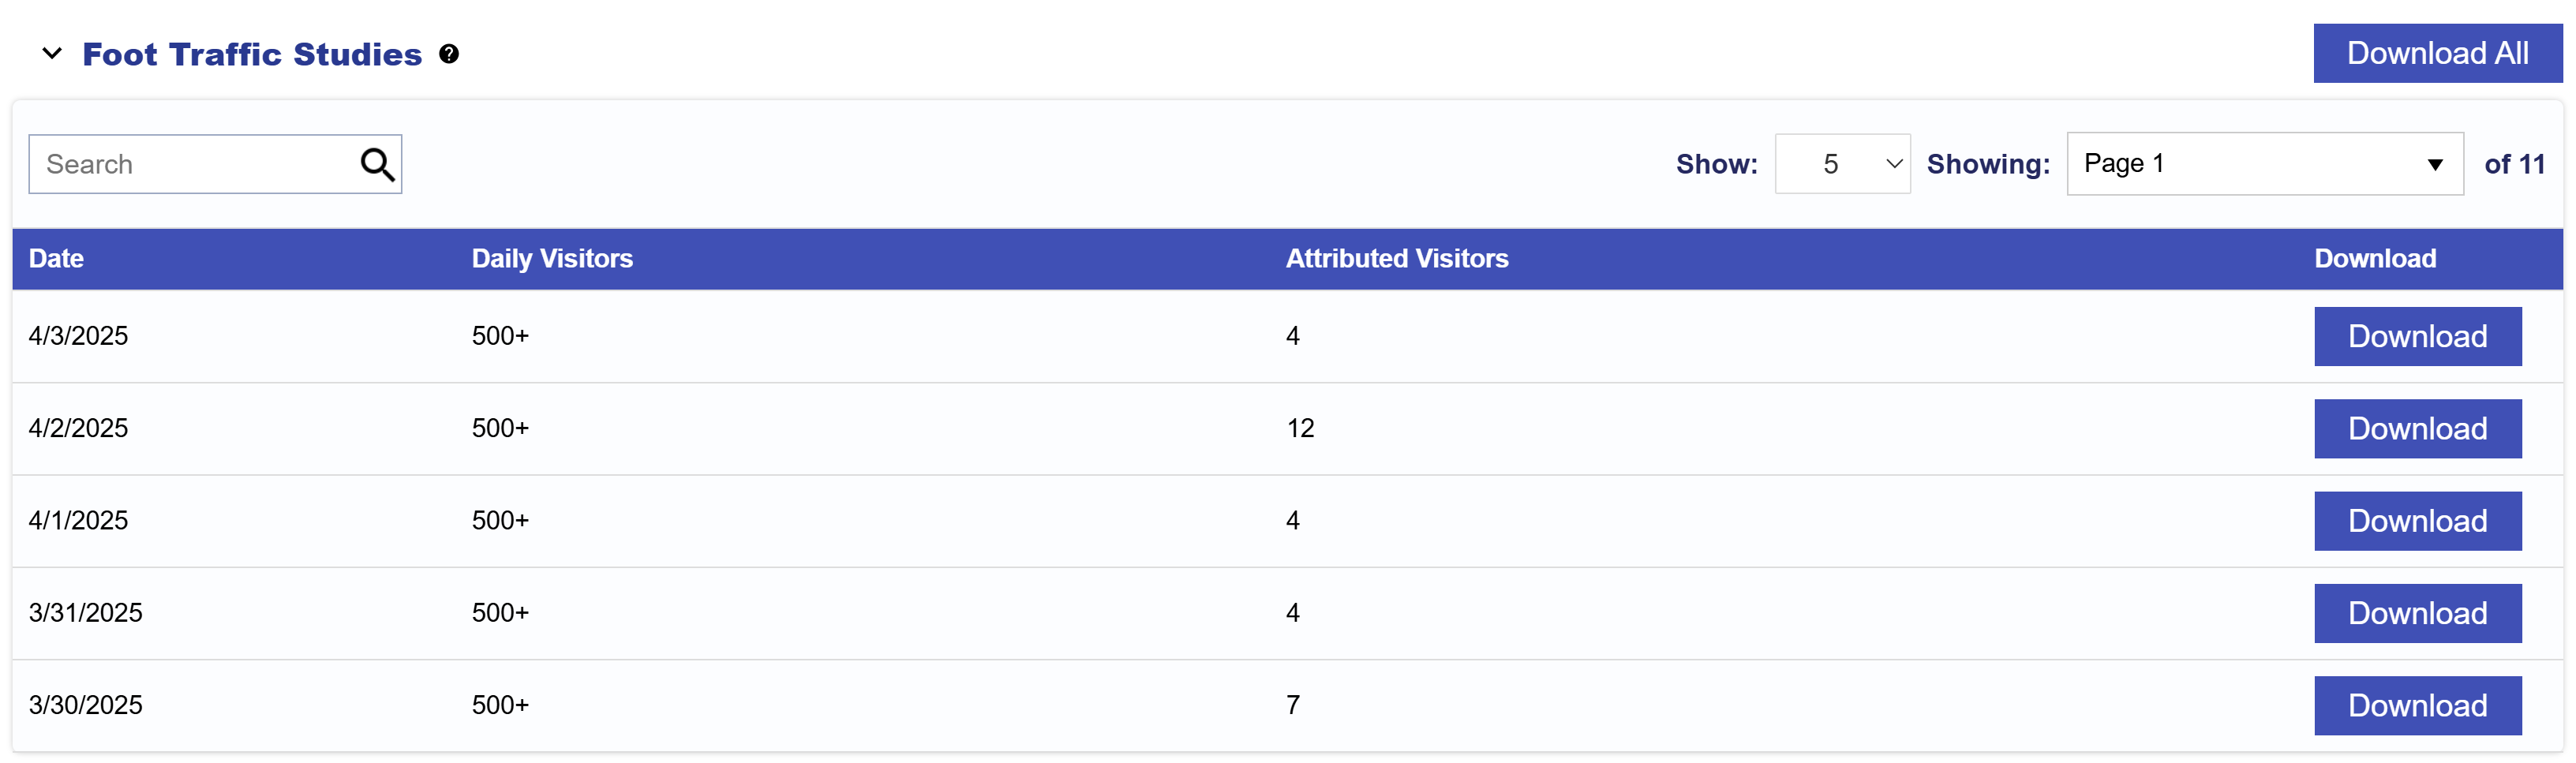
Foot Traffic

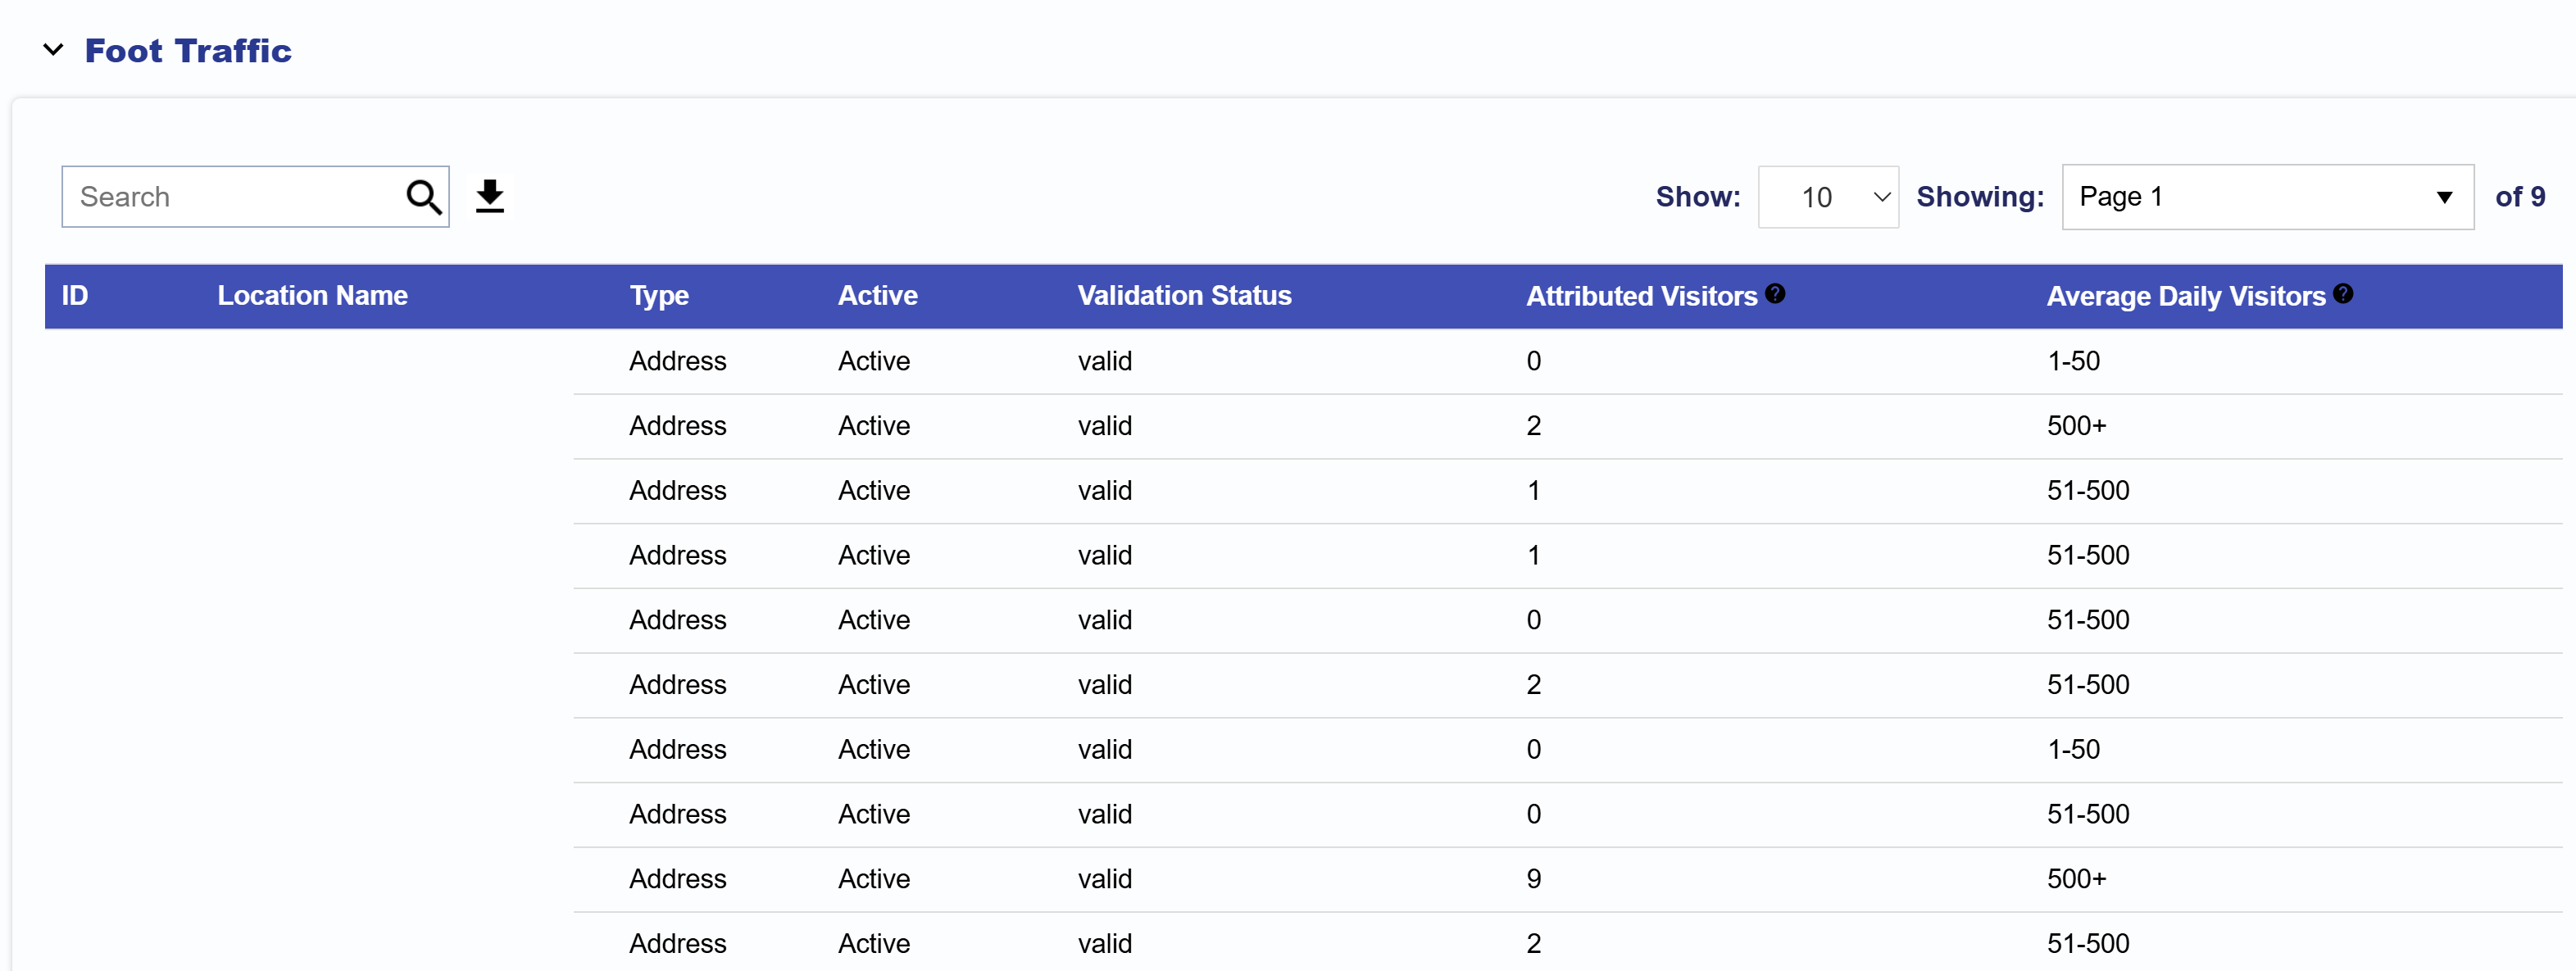
The Foot Traffic section shows the following metrics:

  • Location ID: Unique identifier assigned to the location.
  • Location Name: The name assigned to the Location.
  • Type: Specifies the location type (e.g., Address).
  • Active Status: Indicates whether the location is Active or Inactive.
  • Validation Status: Displays if the location is Valid or Invalid.
  • Attributed Visitors: The number of users who were served an Ad from this Campaign and subsequently visited this location during the selected Reporting Interval.
  • Average Daily Visitor: The average number of total visitors recorded at this location per day within selected reporting interval. This is used to indicate if the address entered is correct and tracking visitors. If 0 visitors are seen at this location, there may be an issue. Contact your Account Manager for more information or for assistance with locations displaying 0 visitors.

The table can be downloaded as a CSV file for further analysis. Click the download button next to the search bar at the top of the table.

Geo

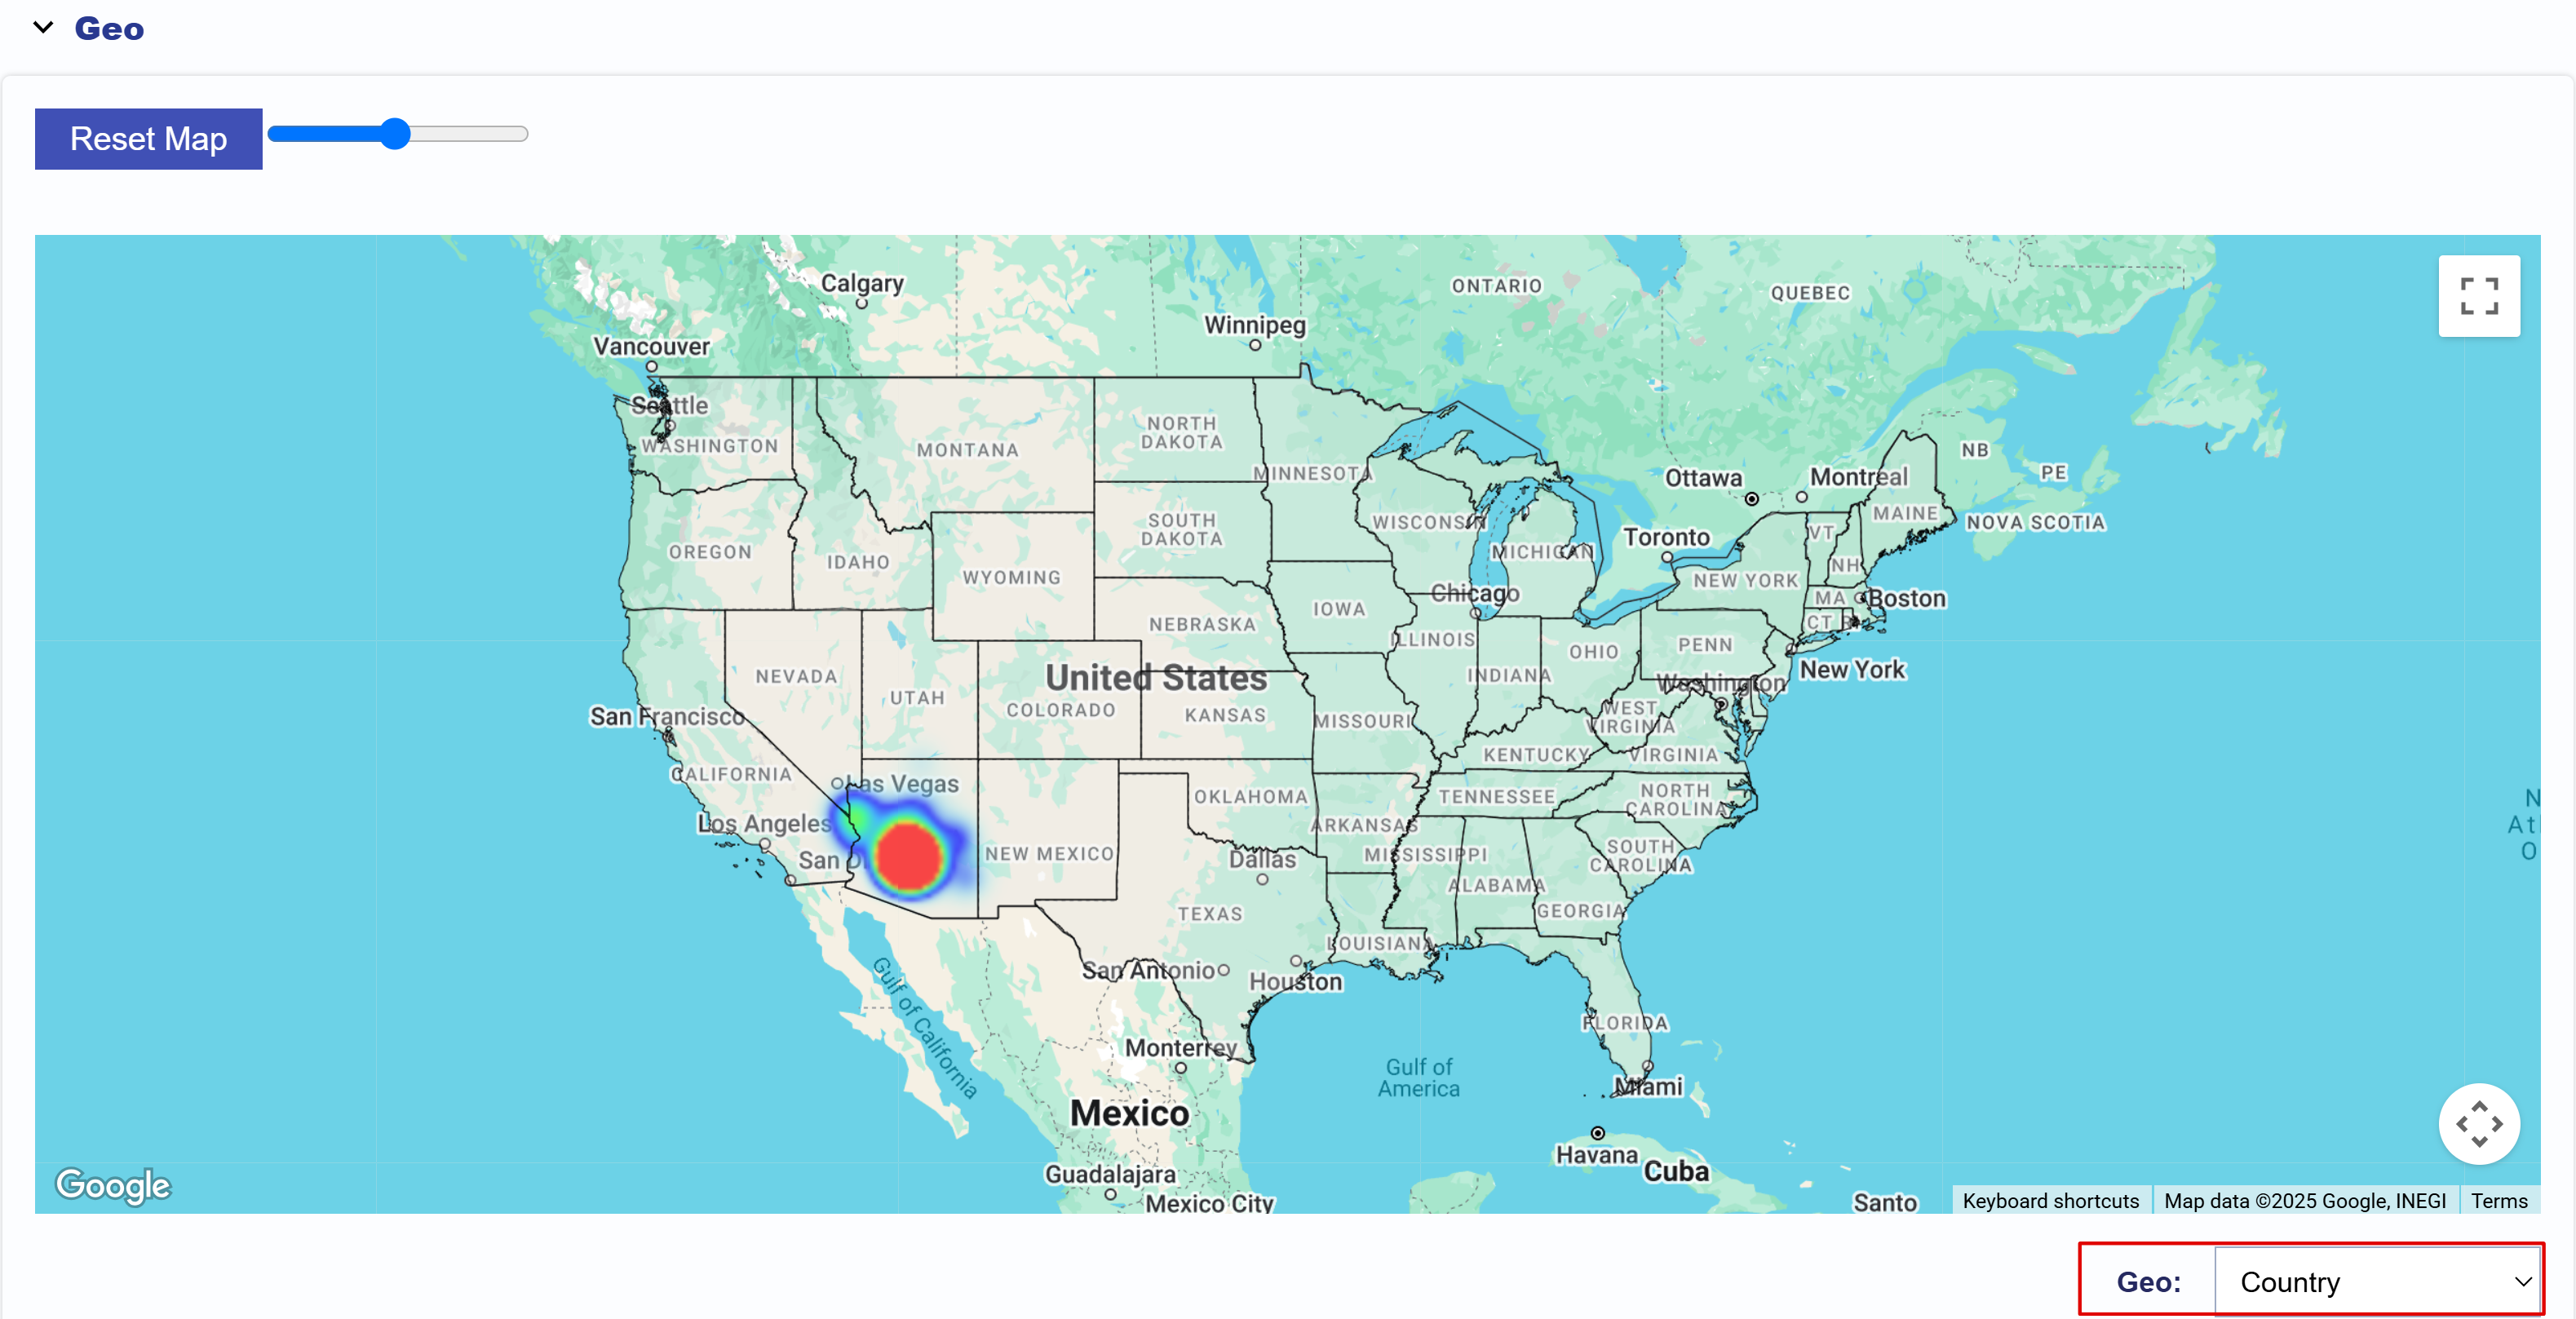
The Geo section shows a heat map of where impressions served were most concentrated. Use the Geo filter located on the bottom right corner of the Map to filter for Country, Region, DMA, and Zip codes. This filter also impacts the table below the map, which can be downloaded as a CSV file to conduct further analysis.

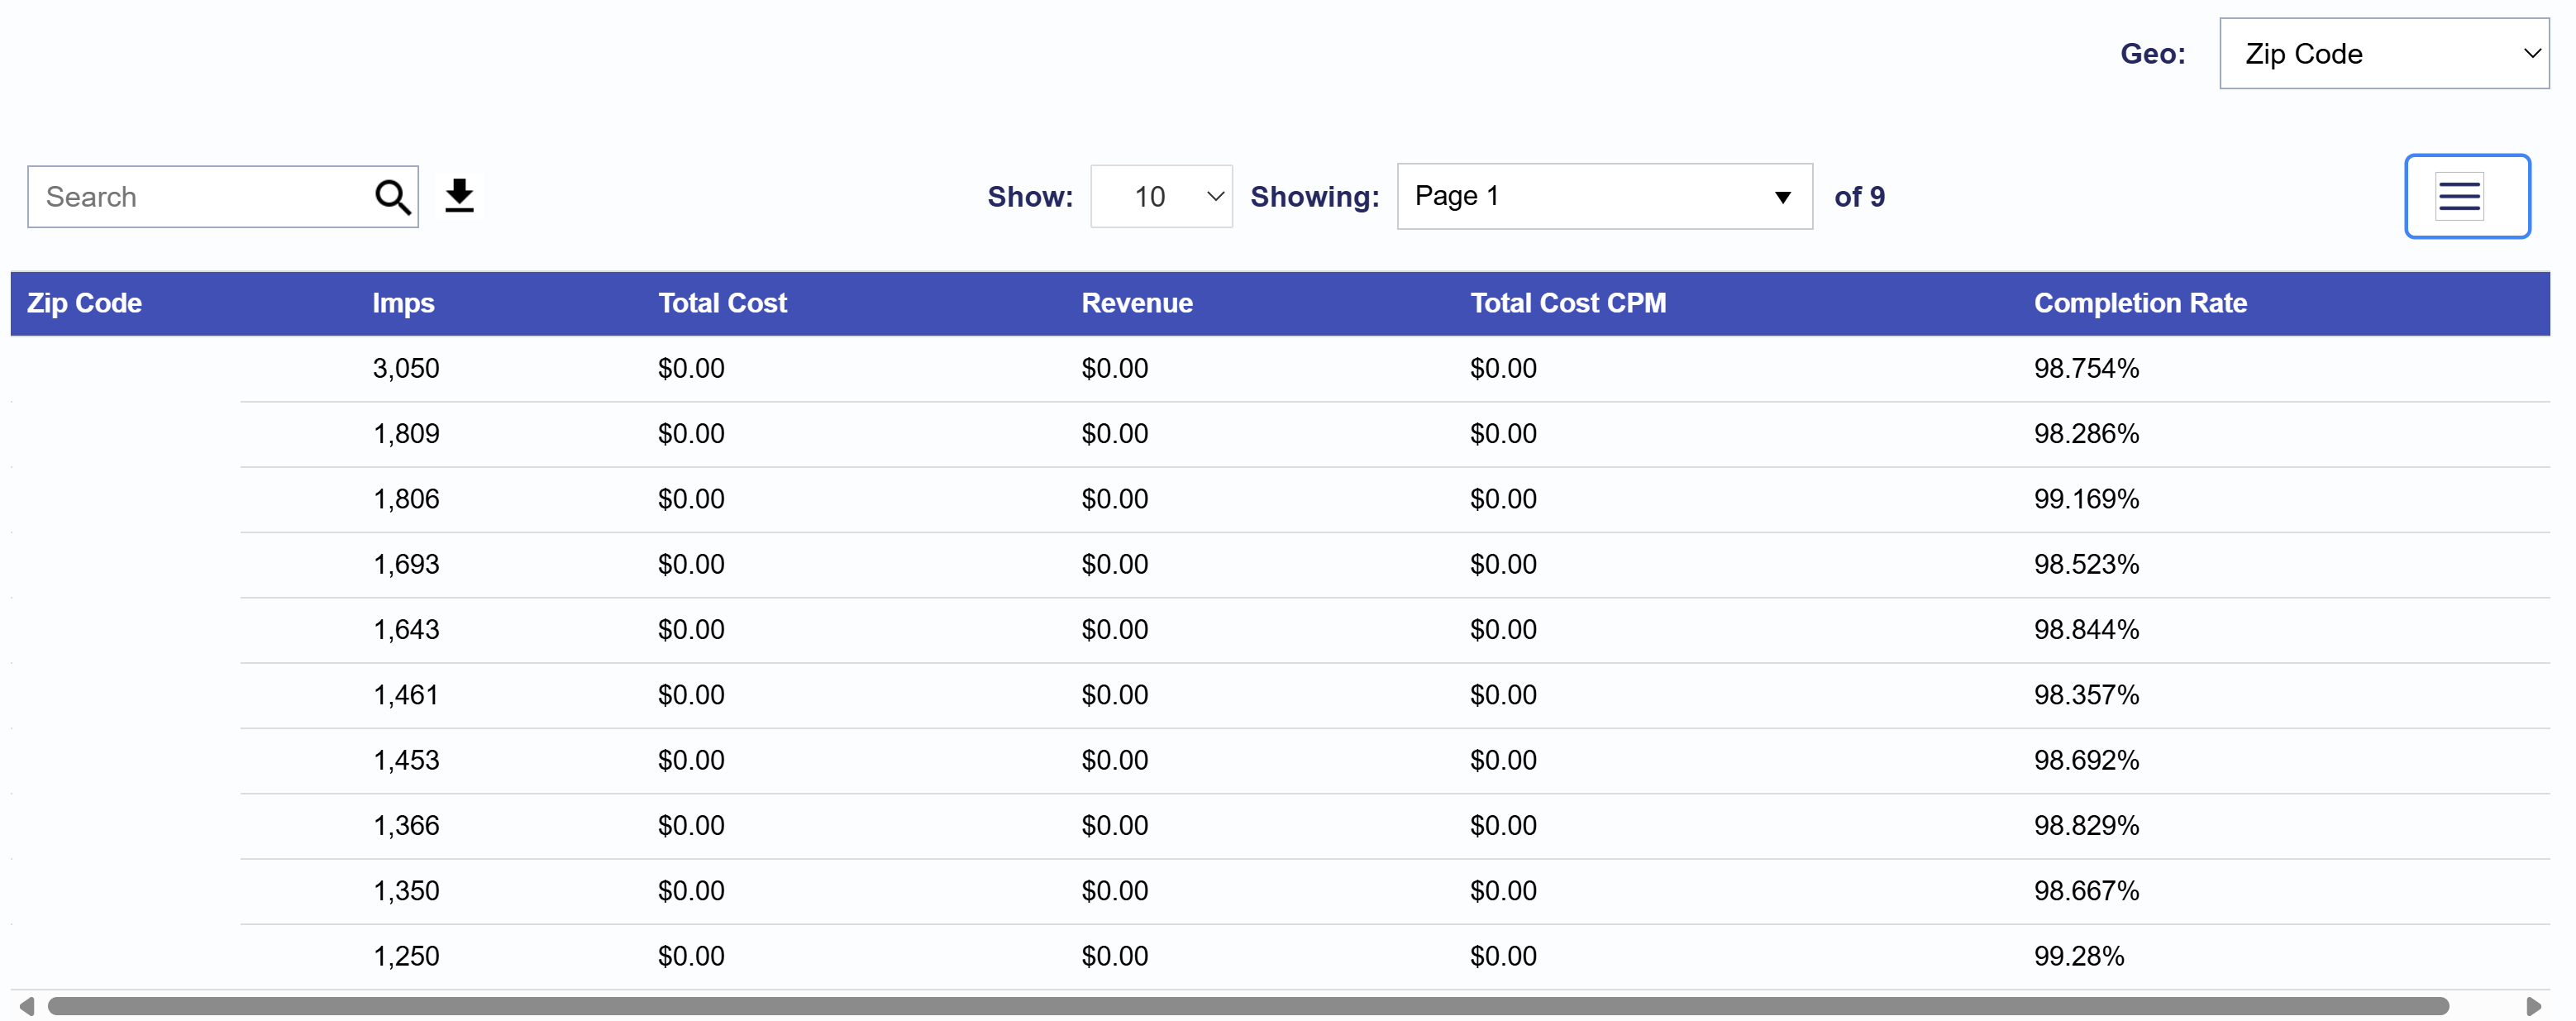
The table displays metrics based on the selected filters. For example, to view Impressions, Total Cost, Revenue, Total Cost CPM, and Completion Rate by Zip Code, apply the Geo filter for Zip Codes.

Overview

Custom reporting allows you to select and customize all dimensions and metrics you wish to evaluate, providing an exportable CSV with Campaign data. You can choose Advertisers, Campaigns, Line Items, Dimensions, Metrics, and a Date Range to generate a report. All reports are created in UTC time zone.

Custom Report Types

  • Custom Report
  • IP Conversion Pixel: Path to Conversion
  • IP Conversion Pixel: Page Visits
  • IP Conversion Pixel: Conversion Rate
  • Log Level Reporting
  • Reach/Frequency Report

Report Availability

  • Reports remain downloadable in the platform for 30 days.
  • After expiration, reports must be rerun. Note that some data points may no longer be available.

Report Limitations

  • Maximum Rows: Custom Reports are limited to 10,000,000 rows, depending on the delivery method and report type selected.
  • Incomplete Data Warning: If a report exceeds this limit, a yellow caution symbol will appear next to the report name, indicating that the data is incomplete.
    • If you require additional data beyond this limit, you can:
      • Split the report into multiple smaller reports.
      • Reduce the number of selected dimensions to decrease row count.
      • Contact your Account Manager for assistance.

Custom Reporting Time Zone

The time zone for custom reports can be configured on each individual report. Note, metrics will only match billing if the report is pulled in UTC. Custom reports may not match the metrics shown in the platform if they are not pulled in the seat time zone.

User time zone will use the ‘user time zone offset’ from the bid request to adjust report metrics for each impression to the time zone where that impression was served. When the user’s time zone offset is not present in the bid request, it will be defaulted to UTC.

Seat Time Zone

The time zone for your account can be configured under the ‘Admin’ section of the platform in ‘Seat Settings’ under ‘Preferences’. This time zone setting will adjust the metrics in the advertiser tab (advertisers, campaign and line item metrics) as well as the reporting dashboard. Note: this does not apply to billing metrics in the account balance or the pacing and dayparts on campaigns or lines. All billing metrics and transactions are for account activity in UTC. Pacing and dayparting time zones can be configured on each campaign or line.

Note that all platform activity appears in the account balance and is billed in UTC time zone.

Scheduled Reports

Custom reports can be automatically delivered to your email, FTP or S3 bucket, or Google Cloud Storage on the schedule of your choice. When creating a custom report, select the ‘Schedule Automated Report’ box, then open the ‘Scheduled Reports’ tab to choose the schedule and configure the delivery method.

When creating a new Custom Report and selecting Schedule Automated Report, the Scheduled Reports tab becomes editable. Complete the setup by selecting the following:

  • Report Frequency:
    • Daily: Reports will be sent each morning for the previous day.
    • Weekly: Reports will be delivered on Monday mornings for the previous week.
    • Monthly: Reports will be delivered on the first of each month for the previous month.
    • Custom:
      • Set a specific day frequency. For example, every 2 days.
      • Set a specific week frequency on a specific day. For example, every 2 weeks on Monday.
  • Reporting Interval: Yesterday, Last 7 days, Last 30 days, Month to Date, Previous Month, Custom
    • Custom: Last __ Days
  • Deliver by: Choose delivery method by selecting the checkbox for each.
    • Email
      • Email addresses should be separated by comma.
    • FTP
      • FTP Server
      • FTP Path
      • FTP Port
      • FTP Username
        FTP Password
    • AWS S3
      • Bucket: This is the name of the bucket, e.g. example.bucket. Bucket name does not contain a leading backslash or the s3:// prefix.
        • Creating a bucket in AWS S3:
          • In AWS S3 click Create Bucket
          • Chose a bucket name that is available and the desired AWS Region.
          • Change Object Ownership to ACLs enabled.
          • Uncheck Block all public access field and check “I acknowledge that the current settings might result in this bucket and the objects within becoming public”.
          • Click Create bucket.
          • Navigate to the newly created bucket and click Create folder with the output path that we chose in Pontiac (“output-path”). Confirm to create the folder.
        • Setting up the report in Pontiac:
          • Go to Reporting tab and then click New Custom Report.
          • Select Log Level Report from the Report Type Drop Down
          • Go to Scheduled Reports tab and check Deliver by S3 box.
          • In the expandable section fill out the Bucket field with the AWS S3 Bucket name. Example: S3-test-bucket.
          • Fill out the Path field with a desired output path location and file name (To include the date macro use dateInt (YYYYMMDD) like xxx/filename-%dateInt% otherwise your file will be overwritten each day). Example: output-path/Pontiac-reports.csv or output-path/Pontiac-reports-%dateInt%.csv
          • Click View security policy and copy the full text area.
          • Go to Amazon AWS S3 and modify permissions for the bucket we chose earlier. In the Permissions tab click Edit and paste the policy text from earlier and Save.
          • Back in Pontiac reports screen click Verify and wait for a successful confirmation message.
      • Path: This will be the full location that the report is saved to. To include the date macro use dateInt (YYYYMMDD) like xxx/filename-%dateInt% otherwise your file will be overwritten each day.
      • View Security Policy
      • Verify your configured bucket policy.
    • Google Cloud Storage
      • Bucket: This is the name of the bucket, e.g. example.bucket. Bucket name does not contain a leading backslash or the gs:// prefix.
      • Path: This will be the full location that the report is saved to. To include the date macro use dateInt (YYYYMMDD) like xxx/filename-%dateInt% otherwise your file will be overwritten each day.
      • Credentials: Valid json object.

Custom Report

Overview

Custom reporting allows you to customize all the dimensions and metrics you wish to evaluate, providing an exportable csv with all the data from your campaigns.

Create a Standard Custom Report:

  1. Navigate to the Reporting Tab and open the Custom Reporting dropdown section.
  2. Click ‘New Custom Report’.
  3. Select ‘Custom Report’ as the Type.
  4. Fill out the required report details.
  5. Click ‘Save’.
  6. Expand the Custom Reporting dropdown section and click the ‘Download’ button associated with the name of your custom report.
    • If Scheduled Automated Reports were selected, the report will be accessible via your chosen delivery method.

Below are the customizations available when creating the report:

  • Name: Enter a title for your report.
  • Schedule Automated Report: Choose this option to have the report sent to you on regular intervals. See the section for setup details Scheduled Reports
  • Advertiser ID: Select the Advertiser IDs that you would like to include in your report. By default, all Advertisers are included.
  • Campaign ID: Select the Campaign IDs that you would like to include in your report. By default, all Campaigns under the selected Advertisers are included.
  • Line ID: Select the Line IDs that you would like to include in your report. By default, all Lines under the selected Advertisers and Campaigns are included.
  • Start Date: Define the start date for the report interval.
  • End Date: Define the end date for the report interval.
  • Type: Choose the type of report. See each section for more details on report types.
    • Custom Report
    • IP Conversion Pixel: Path to Conversion
    • IP Conversion Pixel: Page Visits
    • IP Conversion Pixel: Conversion Rate
    • Log Level Report
    • Reach/Frequency Report.
  • Timezone: Select the timezone that the report will generate, such as Seat Time Zone, User Time Zone, UTC, etc.
  • Dimensions: Categorical values that define how data is grouped and segmented in reports, such as Campaign Name, Advertiser, and Exchange.
  • Metrics: Quantitative values that measure performance, such as impressions, clicks, conversions, spend, and CTR.

Dimensions:

  • Date
  • Advertiser ID
  • Advertiser Name
  • Advertiser Code
  • Campaign ID
  • Campaign Name
  • Campaign Code
  • Line ID
  • Line Name
  • Line Code
  • Creative ID
  • Creative Name
  • Creative Size
  • Region/State Code
  • Region/State Name
  • Country Code
  • Country Name
  • DMA Code
  • DMA Name
  • Zip Code
  • Browser
  • Operating System
  • Site Domain
  • Exchange
  • App Domain
  • App Bundle
  • App Name
  • Publisher Name
  • Device Type
  • Device Model
  • Deal ID
  • Deal Name
  • Content Genre
  • Content Episode
  • Content Title
  • Content Series
  • Content Channel
  • Content Network
  • Hour
  • Device Type Name
  • Inventory Type
  • Multi Field

Metrics:

  • Impressions
  • Media Cost
  • Total Cost
  • Revenue
  • Media Cost CPM
  • Total Cost CPM
  • Revenue CPM
  • Profit
  • Video Starts
  • 25% Video Complete
  • 50% Video Complete
  • 75% Video Complete
  • Video Completions
  • Video Clicks
  • Chrome Conversions
  • Data Costs
  • Art Fee
  • DCM Hosting Fee
  • CC Fee
  • Foot Traffic Fee
  • Contextual Fee
  • Chalice Fee

IP Conversion Pixel: Path To Conversion

Overview

The ‘Path to Conversion’ report provides data on IP conversions and impressions served to users who later converted. It shows the complete journey from an impression view to the conversion action on your website, helping you understand how impressions influence conversions over time.

Key Columns:

  • Impression Time: Indicates when the impression was served to a user who later visited or converted on the site where the pixel is placed. The total number of ‘imp_times’ shows how many impressions were served to users who then converted, corresponding to the ‘Attributed Imps’ field in the IP Conversion Pixel metrics under the Advertiser.
  • Conversion Time: Shows the time the conversion or action occurred. The total number of unique ‘conv_times’ represents the total number of conversions or visits driven by the campaign, corresponding to the ‘Total Convs’ field in the IP Conversion Pixel metrics under the Advertiser.

Lookback Window:

  • By default, the IP conversion pixels use a 30-day lookback window. However, if you need to pull data with a custom lookback window, you can select a value up to 30 days from the ‘Lookback Window’ dropdown.

Create an IP Conversion Pixel: Path to Conversion Report

  1. Navigate to the Reporting tab and open the Custom Reporting dropdown section.
  2. Click ‘New Custom Report’.
  3. Select ‘IP Conversion Pixel: Path to Conversion’ as the Type.
  4. Fill out the required report details.
  5. Click ‘Save’.
  6. Expand the Custom Reporting dropdown section and click the ‘Download’ button next to the name of your custom report.
    • If Scheduled Automated Reports were selected, the report will be delivered via your chosen delivery method.

Below are the customizations available when creating the report:

  • Name: Enter a title for your report.
  • Schedule Automated Report: Choose this option to have the report sent to you on regular intervals. See the section for setup details Scheduled Reports
  • Advertiser ID: Select the Advertiser IDs that you would like to include in your report. By default, all Advertisers are included.
  • Campaign ID: Select the Campaign IDs that you would like to include in your report. By default, all Campaigns under the selected Advertisers are included.
  • Line ID: Select the Line IDs that you would like to include in your report. By default, all Lines under the selected Advertisers and Campaigns are included.
  • Pixel ID: Select the Pixel IDs that you would like to include in your report. By default, all Pixels are included.
  • Start Date: Define the start date for the report interval.
  • End Date: Define the end date for the report interval.
  • Type: Choose the type of report. See each section for more details on report types.
    • Custom Report
    • IP Conversion Pixel: Path to Conversion
    • IP Conversion Pixel: Page Visits
    • IP Conversion Pixel: Conversion Rate
    • Log Level Report
    • Reach/Frequency Report.
  • Timezone: Select the timezone that the report will generate, such as Seat Time Zone, User Time Zone, UTC, etc.
  • Lookback window: By default, the IP conversion pixels use a 30-day lookback window.
  • Dimensions: Categorical values that define how data is grouped and segmented in reports, such as Campaign Name, Advertiser, and Impression Time.
  • Metrics: Quantitative values that measure performance, such as fractional attribution.

Dimensions:

  • Pixel ID
  • Pixel Name
  • Conversion Time
  • Impression Time
  • IP Address Truncated
  • IP Address Hashed
  • Home or Business
  • Zip Code
  • Site Domain
  • Exchange
  • Region/State Code
  • User ID
  • Advertiser ID
  • Advertiser Name
  • Line ID
  • Line Name
  • Date
  • Device Type
  • Creative ID
  • Creative Name
  • App Domain
  • App Bundle
  • App Name
  • Order ID: Reporting on this field requires this value to be dynamically passed on the IP Pixel using the Order Value or Order ID parameters. Check the Order ID or Order Value boxes when creating the IP Pixel for further guidance.
  • Order Value: Reporting on this field requires this value to be dynamically passed on the IP Pixel using the Order Value or Order ID parameters. Check the Order ID or Order Value boxes when creating the IP Pixel for further guidance.
  • Deal Name
  • Publisher Name
  • Content Network
  • Content Channel
  • Content Series
  • Content Title
  • Content Genre
  • Custom Variable 1
  • Custom Variable 2
  • Custom Variable 3
  • Custom Variable 4
  • Other Parameters
  • Consumer ID
  • Campaign ID
  • Campaign Name
  • Conversion Date
  • Impression Date
  • Operating System
  • Browser
  • User Agent
  • Device Type Name
  • Inventory Type

Metrics:

  • Fractional Attribution: Assigns an evenly weighted conversion value to each impression event that leads to a conversion.

IP Conversion Pixel: Page Visits

Overview

The IP Conversion Pixel: Page Visits report pulls data on page visits associated with the IP Conversion Pixel. It only includes visit data at the advertiser level and is not tied to specific lines. Each record in this report represents a user visiting your page, independent of any media served.

Create an IP Conversion Pixel: Page Visits Report:

  1. Navigate to the Reporting Tab and open the Custom Reporting dropdown section.
  2. Click ‘New Custom Report’.
  3. Select ‘IP Conversion Pixel: Page Visits’ as the Type.
  4. Fill out the required report details.
  5. Click ‘Save’.
  6. Expand the Custom Reporting dropdown section and click the ‘Download’ button associated with the name of your custom report.
    • If Scheduled Automated Reports were selected, the report will be accessible via your chosen delivery method.

Below are the customizations available when creating the report:

  • Name: Enter a title for your report.
  • Schedule Automated Report: Choose this option to have the report sent to you on regular intervals. See the section for setup details Scheduled Reports
  • Advertiser ID: Select the Advertiser IDs that you would like to include in your report. By default, all Advertisers are included.
  • Pixel ID: Select the Pixel IDs that you would like to include in your report. By default, all Pixels are included.
  • Start Date: Define the start date for the report interval.
  • End Date: Define the end date for the report interval.
  • Type: Choose the type of report. See each section for more details on report types.
    • Custom Report
    • IP Conversion Pixel: Path to Conversion
    • IP Conversion Pixel: Page Visits
    • IP Conversion Pixel: Conversion Rate
    • Log Level Report
    • Reach/Frequency Report.
  • Timezone: Select the timezone that the report will generate, such as Seat Time Zone, User Time Zone, UTC, etc.
  • Dimensions: Categorical values that define how data is grouped and segmented in reports, such as Campaign Name, Advertiser, and Impression Time.

Dimensions:

  • Pixel ID
  • Pixel Name
  • Conversion Time
  • Impression Time
  • IP Address Truncated
  • IP Address Hashed
  • Home or Business
  • Zip Code
  • Region/State Code
  • Advertiser ID
  • Date
  • Custom Variable 1
  • Custom Variable 2
  • Custom Variable 3
  • Custom Variable 4
  • Other Parameters
  • Order ID: Reporting on this field requires this value to be dynamically passed on the IP Pixel using the Order Value or Order ID parameters. Check the Order ID or Order Value boxes when creating the IP Pixel for further guidance.
  • Order Value: Reporting on this field requires this value to be dynamically passed on the IP Pixel using the Order Value or Order ID parameters. Check the Order ID or Order Value boxes when creating the IP Pixel for further guidance.
  • Consumer ID

IP Conversion Pixel: Conversion Rate

Overview

The ‘Conversion Rate Report’ helps track the effectiveness of your ads by analyzing conversion rates day over day. To calculate the conversion rate for each day, divide ‘Conversions’ by ‘Imps’.

The conversion metric in this report matches the UI metrics when the ‘Line’ dimension is included. When this dimension is selected, conversions are not de-duplicated across line items. For example, if a user sees ads from two Lines under the same Campaign and completes one purchase, this will count as a conversion for both Line Items, and the Campaign will show two conversions.

For unique conversions across an advertiser or campaign, you can run a custom ‘IP Conversion Rate’ report without selecting the ‘Line ID’ dimension. This report will show unique conversions on the selected date(s). For unique conversions across a campaign flight, run the ‘IP Path to Conversion Report’ and de-duplicate the hashed IP address across all dates.

Create an IP Conversion Pixel: Conversion Rate Report

  1. Navigate to the Reporting tab and open the Custom Reporting dropdown section.
  2. Click ‘New Custom Report’.
  3. Select ‘IP Conversion Pixel: Conversion Rate’ as the Type.
  4. Fill out the required report details.
  5. Click ‘Save’.
  6. Expand the Custom Reporting dropdown section and click the ‘Download’ button next to the name of your custom report.
    • If Scheduled Automated Reports were selected, the report will be delivered via your chosen delivery method.

Below are the customizations available when creating the report:

  • Name: Enter a title for your report.
  • Schedule Automated Report: Choose this option to have the report sent to you on regular intervals. See the section for setup details Scheduled Reports
  • Advertiser ID: Select the Advertiser IDs that you would like to include in your report. By default, all Advertisers are included.
  • Campaign ID: Select the Campaign IDs that you would like to include in your report. By default, all Campaigns under the selected Advertisers are included.
  • Line ID: Select the Line IDs that you would like to include in your report. By default, all Lines under the selected Advertisers and Campaigns are included.
  • Pixel ID: Select the Pixel IDs that you would like to include in your report. By default, all Pixels are included.
  • Start Date: Define the start date for the report interval.
  • End Date: Define the end date for the report interval.
  • Type: Choose the type of report. See each section for more details on report types.
    • Custom Report
    • IP Conversion Pixel: Path to Conversion
    • IP Conversion Pixel: Page Visits
    • IP Conversion Pixel: Conversion Rate
    • Log Level Report
    • Reach/Frequency Report.
  • Timezone: Select the timezone that the report will generate, such as Seat Time Zone, User Time Zone, UTC, etc.
  • Lookback window: By default, the IP conversion pixels use a 30-day lookback window.
  • Dimensions: Categorical values that define how data is grouped and segmented in reports, such as Line ID and Line Name.

Log Level Reporting

Overview

Log level reporting provides advertisers with detailed bid request data for purchased inventory, with IP addresses and IFAs encrypted for privacy. Reports are delivered daily in UTC for the previous day’s activity. The user time zone offset is included in these reports and can be utilized to adjust the report time zone if needed. To receive log level reports, you must have either an AWS or Google Cloud account and have a scheduled report configured for delivery to s3 or Google Storage. Additionally, certain bid request fields contain numerical values that correspond to specific descriptions. The tables below provide mappings for device type, geo type, video protocol, and livestream values.

Device Type

ValueDescription
1Mobile/Tablet
2Personal Computer
3Connected TV
4Phone
5Tablet
6Connected Device
7Set Top Box

Geo Type

ValueDescription
1GPS/Location Services
2IP Address
3User Provided (e.g. Registration data)

Video Protocol

ValueDescription
1VAST 1.0
2VAST 2.0
3VAST 3.0
4VAST 1.0 Wrapper
5VAST 2.0 Wrapper
6VAST 3.0 Wrapper
7VAST 4.0
8VAST 4.0 Wrapper
9DAAST 1.0
10DAAST 1.0 Wrapper

Livestream

ValueDescription
0Non-live Content
1Live Content

Download the CTV log level report schema for a full list of available fields.

ctv-log-level-report-schemaDownload

Create a Log Level Report:

  1. Navigate to the Reporting tab and open the Custom Reporting dropdown section.
  2. Click ‘New Custom Report’.
  3. Select ‘Log Level’ as the Type.
  4. Fill out the required report details.
  5. Click ‘Save’.
  6. To receive log level reports you must have either an AWS or Google Cloud account and have a scheduled report configured for delivery to s3 or Google Storage.

Below are the customizations available when creating the report:

  • Name: Enter a title for your report.
  • Schedule Automated Report: Choose this option to have the report sent to you on regular intervals. See the section for setup details Scheduled Reports
  • Advertiser ID: Select the Advertiser IDs that you would like to include in your report. By default, all Advertisers are included.
  • Campaign ID: Select the Campaign IDs that you would like to include in your report. By default, all Campaigns under the selected Advertisers are included.
  • Line ID: Select the Line IDs that you would like to include in your report. By default, all Lines under the selected Advertisers and Campaigns are included.
  • Type: Choose the type of report. See each section for more details on report types.
    • Custom Report
    • IP Conversion Pixel: Path to Conversion
    • IP Conversion Pixel: Page Visits
    • IP Conversion Pixel: Conversion Rate
    • Log Level Report
    • Reach/Frequency Report.
  • Columns: Categorical values (dimensions) and quantitative values (metrics).

Below are the column customizations available when creating the report:

  • Exchange
  • Auction ID
  • Impression ID
  • Impression Tag ID
  • Impression Bid Floor
  • Impression Bid Floor Currency
  • Advertiser ID
  • Advertiser Code
  • Campaign ID
  • Campaign Code
  • Line ID
  • Line Code
  • Creative ID
  • Bid Price Millicents
  • Win Price Millicents
  • Impression Timestamp
  • Source FD
  • Source Pchain
  • Creative Type
  • Creative Categories
  • Creative Duration
  • Creative Domain
  • Width
  • Height
  • Video Placement
  • Video Start Delay
  • Video Protocols
  • Device Type
  • Device Connection Type
  • Device IFA
  • Device Make
  • Device Model
  • Geo Country
  • Geo Region
  • Geo Zip
  • Geo Metro
  • Geo Latitude
  • Geo Longitude
  • UTC Offset
  • Geo Type
  • Geo IP Service
  • IP Address Truncated
  • IP Address Hashed
  • IP Address Hashed Std
  • Device Language
  • Operating System
  • OS Version
  • Hardware Version
  • Auction Type
  • BCAT
  • Currency
  • User Agent
  • Browser
  • Site Domain
  • App Bundle
  • App ID
  • App Domain
  • App Name
  • App Category
  • App Store URL
  • Content ID
  • Content Livestream
  • Content Content
  • Content Length
  • Content Genre
  • Content Episode
  • Content Season
  • Content Title
  • Content Series
  • Content URL
  • Content Category
  • Content Network
  • Content Channel
  • Content Content Rating
  • Content Producer Name
  • Publisher ID
  • Publisher Name
  • Publisher Domain
  • Private Auction
  • Deal ID
  • Deal At
  • Deal Bid Floor
  • Deal Bid Floor Currency
  • Data Cost
  • Revenue
  • Total Cost
  • Fees
  • Chrome Conversion
  • Conversion Pixel ID
  • Site Page
  • Foot Traffic Fee
  • Data Comm
  • Art Fee
  • Contextual Fee
  • DCM Hosting Fee
  • CC Fee
  • Chalice Fee
  • Advertiser Name
  • Campaign Name
  • Line Name
  • Creative Name

Reach/Frequency Report

Overview

The Reach/Frequency Report provides insights into the number of unique users reached by a campaign. Select the Advertisers, Campaigns, Lines, and Date Range to generate the report, which includes the following metrics:

  • Unique Device IDs (IFAs)
  • Unique IP Addresses
  • Impressions Served

Estimate frequency by dividing total impressions served by either unique device IDs or unique IP addresses.

Create a Reach/Frequency Report:

  1. Navigate to the Reporting Tab and open the Custom Reporting dropdown section.
  2. Click ‘New Custom Report’.
  3. Select ‘Reach/Frequency’ as the Type.
  4. Fill out the required report details.
  5. Click ‘Save’.
  6. Expand the Custom Reporting dropdown section and click the ‘Download’ button associated with the name of your custom report.
    • If Scheduled Automated Reports were selected, the report will be accessible via your chosen delivery method.

Below are the customizations available when creating the report:

  • Name: Enter a title for your report.
  • Schedule Automated Report: Choose this option to have the report sent to you on regular intervals. See the section for setup details Scheduled Reports
  • Advertiser ID: Select the Advertiser IDs that you would like to include in your report. By default, all Advertisers are included.
  • Pixel ID: Select the Pixel IDs that you would like to include in your report. By default, all Pixels are included.
  • Start Date: Define the start date for the report interval.
  • End Date: Define the end date for the report interval.
  • Type: Choose the type of report. See each section for more details on report types.
    • Custom Report
    • IP Conversion Pixel: Path to Conversion
    • IP Conversion Pixel: Page Visits
    • IP Conversion Pixel: Conversion Rate
    • Log Level Report
    • Reach/Frequency Report.
  • Timezone: Select the timezone that the report will generate, such as Seat Time Zone, User Time Zone, UTC, etc.
  • Dimensions: Categorical values that define how data is grouped and segmented in reports, such as Campaign Name, Advertiser ID, and Line ID.

Dimensions:

  • Advertiser ID
  • Advertiser Name
  • Campaign ID
  • Campaign Name
  • Line ID
  • Line Name

Conversion Tracking

Pontiac IP Conversions

With the Pontiac pixel, a client can place this on their website and attribute online actions (browsing a page, loading the shopping cart, purchases) to CTV campaigns run through the Pontiac platform. Pontiac IP Conversion Pixels are a proprietary and privacy safe attribution solution that utilizes the user’s IP Address to track website traffic and online purchases driven by your campaigns.

To create a new pixel, enter the Pontiac platform and create or open an Advertiser. Once inside the Advertiser, click the ‘New Pixel’ button and enter a name for the pixel. Wait for 30-60 seconds for the pixel to generate, then click back on the name of the pixel to view the code. Both an image version and a script version of the pixel will generate. The format required may depend on the configuration of the website where the pixel will be placed. The pixel should be placed directly in the source code in the header or the body, then associate it to the Line Item where you wish to track conversions.

If you wish to track an action such as purchase, this pixel should be placed on the page the user will see once the transaction is completed, ie. the ‘Thank you’ page. If you want to register any website visit as a conversion (ie. a user that sees your CTV ad, then goes to your homepage), you can place the pixel in the header to fire on all pages, or one specific page you wish to measure.

IP conversion pixels have a standard lookback of 30 days in the metrics under the Advertiser. This means that the user must complete the desired action within 30 days of seeing the ad for it to count as a conversion. If you would like to pull reporting with a custom lookback window, this can be done in Custom Reporting using the IP Conversion Custom Report. You can select from ‘5’, ‘7’, ’15’ or ’30’ day as the lookback.

For metrics in the Advertiser and Campaign screens, a conversion will be attributed to each Line Item that contributed to the action. For example, if a user sees an ad from 2 lines under a campaign and then completes one purchase, this will be counted as a conversion attributed to both Line Items, appearing as 2 conversions on the Campaign when aggregated.

If you would like to see unique conversions under an advertiser or campaign, you can run a custom ‘IP Conversion Rate’ report without selecting the ‘Line ID’ dimension. These are uniques on the selected dates. For uniques across a campaign flight, run an ‘IP Path to Conversion Report’ and de-duplicate the hashed IP address across all dates.

Query String Parameters

Client IP is a parameter that can be used to pass the IP address seen by your website for the visitor when the pixel loads. This parameter should be used when the pixel is placed in a container or in any case where the IP that would be registered by the pixel would be inaccurate. For loads where Client IP is present, this will be used in attribution and reporting.

To track Order ID, Order Value, and Customer ID using this pixel, select the boxes for these values once the pixel has generated. This will add the parameters and placeholders for the values to the pixel. Work with your web developer to dynamically replace these placeholders with the intended values. These values can then be pulled in Custom Reporting to gather additional insight about conversions driven by your campaigns & optimize towards ROAS.

Google Privacy Sandbox: Chrome Conversions

Through integration with the Google Privacy Sandbox, Pontiac pixels can also be used to track cookieless conversions that occur in Chrome browsers for online video campaigns. To activate with the Google Privacy Sandbox, the advertiser in the Pontiac platform will need to be created with the website where conversions will be tracked in the ‘Advertiser Domain’ field. On the Pontiac pixel, check the ‘Track Chrome Conversions’ check box. This pixel should then be placed on the Advertiser’s website where the conversion event will take place. For example, this could be the ‘thank you’ page the user will land on after a purchase.

Overview

Foot Traffic Attribution is a conversion tracking feature powered by OnSpot, enabling advertisers to measure how many users were served an ad through Pontiac and then visited a tracked commercial location. This is achieved by leveraging Mobile Advertising IDs and GPS data from mobile devices.

How It Works

  • Mobile Attribution: OnSpot registers users who were served your ad and whose mobile device was later detected at the tracked location.
  • CTV Household Extension: For CTV campaigns, household extension technology links TVs, desktops, and laptops to mobile devices using IP addresses, allowing mobile GPS data to attribute visits from the same household.
  • Currently only available in the United States.
  • Each Line Item can track up to 200 locations.

Setup & Availability

  • Availability: Foot Traffic Reporting is currently available only in the United States.
  • Tracking Limits: Each Line Item can track up to 200 locations.
  • Setup in Pontiac:
    1. Enable Foot Traffic Attribution by checking the ‘Enable Foot Traffic’ box when setting up a Line Item.
    2. Under the ‘Foot Traffic Reporting’ section, click ‘Add Location’ to specify the locations to track.
      • See the following documentation for more detail on the methods of adding locations: Line Foot Traffic Reporting
      • Pricing: A $4.00 fee is added to CTV Line Items with Foot Traffic enabled.
  • Download Report:
    1. Navigate to the Reporting tab and open the Foot Traffic Studies section.
    2. Find the desired date and click the associated Download or Download All buttons to retrieve the report.
      • Foot Traffic Reports will generate daily with a 5 day delay. For example, if the report for visits that occurred on the 1/15 the report will generate on 1/20.

The following metrics are included in the report:

  • Date: The specific date for which the data is recorded.
  • Line ID: The unique identifier assigned to the Line.
  • Line Name: The name of the Line associated with the Campaign.
  • Campaign ID: The unique identifier assigned to the Campaign.
  • Campaign Name: The name of the Campaign associated with the Line.
  • Location ID: Unique identifier assigned to the Location.
  • Location Name: The name assigned to the Location.
  • Daily Visitors: The number of total visitors recorded at this location on the report’s date. This is used to indicate if the address entered is correct and tracking visitors. If 0 visitors are seen at this location, there may be an issue. Contact your Account Manager for more information or for assistance with locations displaying 0 visitors.
  • Attributed Visitors: The number of users who were served an ad from this Campaign and subsequently visited this location on the report’s date.

© 2025 Pontiac Wiki Sec · All Rights Reserved · Developed by RDK

  • Contact Us
  • Privacy Policy
  • Terms & Conditions
  • Pontiac.media