Blockers
The Blockers section shows which categories are preventing bid requests from becoming eligible for the Line.
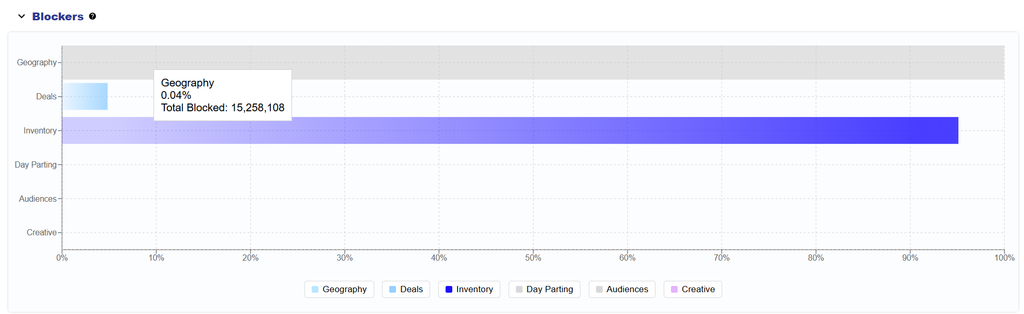
Blocked requests are grouped into categories including:
- Geography
- Deals
- Inventory
- Day Parting
- Audiences
- Creative
Hover over a category to view its Blocked % and Total Blocked. Use the legend to hide or restore categories and rescale the chart.
Because blocker categories are calculated independently, the same request may be blocked by more than one category.
Use Blockers to identify which restrictions are having the greatest impact on Eligible Requests, then review the applicable Targeting or serving configuration.
For detailed definitions and guidance on interpreting the graph, see Blockers Graph.