Inventory Availability Tool
The Inventory Availability Tool is a forecasting tool that provides directional guidance in Campaign planning. If your report returns no data, reach out through the Help Center for more information on the feasibility and potential scale for the selected targeting. By leveraging historical data, delivery trends, sample log data, and Pontiac’s proprietary forecasting formula, the tool helps advertisers:
- Create and refine Inventory targeting lists.
- Assess the feasibility of targeting parameters.
- Optimize bid strategies.
- Estimate potential scale for Campaign planning.
Create an Inventory Availability Report
- Switch to the ‘ART’ section using the toggle in the top right corner.
- If the ‘ART’ button is unavailable, contact Pontiac Support via the Help Center.
- Navigate to the ‘Inventory Availability’ tab.
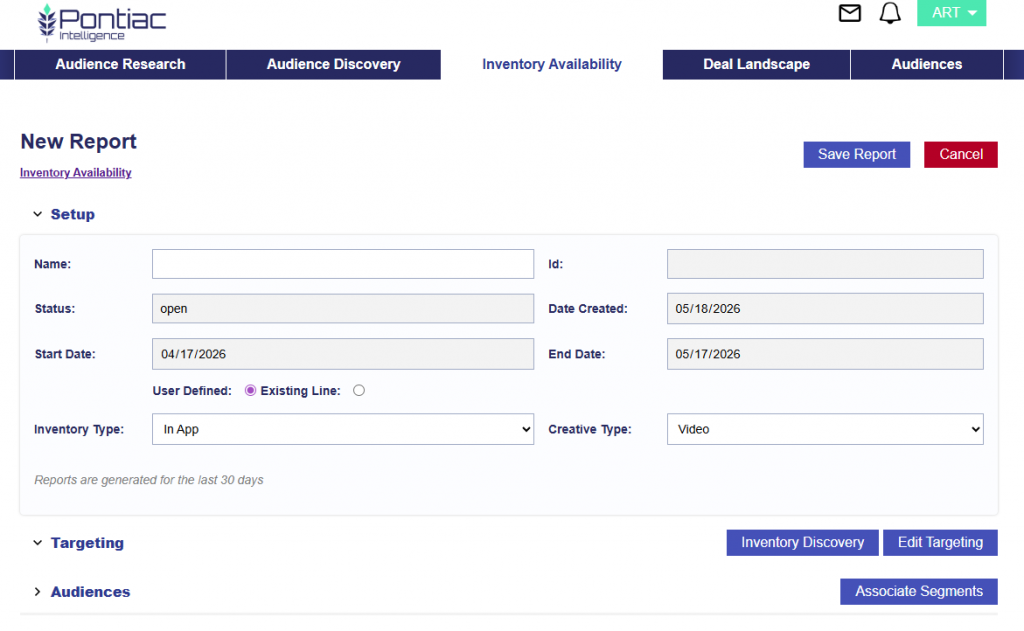
- Click ‘New Report’.
- The start date and end date default to 30 days before today’s date.
- Select how the report is built:
- User Defined: Configure the report from scratch. This is great for when you’re gather precampaign insights.
- Existing Line: Configure the report based on an existing line that is already set up. This is helpful for QAing campaign set up and delivery issues. When selected, the report is generated using the line’s current configuration, including:
- Inventory type
- Creative type
- Advertiser
- Campaign
- Line
- Effective targeting (Intersection of the Campaign and Line)
- Audiences (only Line level)
- If audiences are applied to the Campaign level, users can manually add an additional group and then run the report, but it will not be automatically included.
- Select Inventory Type: In App, Web or Combined.
- Select the Creative Type: Video, Audio, or Banner.
- Only one creative type can be selected per report. If you need to run the same report for different creative types, clone the original report and update the creative type.
- Add Targeting parameters by the follow two methods
- Edit Targeting: Select parameters for forecasting.
- Available targeting options for In App include:
- Deals
- Exchanges
- Geo (Country, Regions, DMAs)
- Zip Codes
- Livestream
- App Lists
- Apps
- Device Types
- Channel
- Network
- Publisher
- Genre
- Series
- Title
- Multi Field
- Available targeting options for Web include:
- Deals
- Exchanges
- Geo (Country, Regions, DMAs)
- Zip Codes
- Livestream
- Publisher
- Site Lists
- Sites
- Device Types
- Available targeting options for Combined include:
- Deals
- Exchanges
- Geo (Country, Regions, DMAs)
- Zip Codes
- Livestream
- Publisher
- Deal Lists
- Device Types
- Site Lists
- Sites
- App Lists
- Apps
- Channel
- Network
- Publisher
- Genre
- Series
- Title
- Multifield
- Available targeting options for In App include:
- Inventory Discovery: Due to the inconsistency in how inventory information is structured across the CTV landscape, this tool helps advertisers create well-informed targeting lists and identify variations in formatting for the desired inventory.
- Search and click to add fields to targeting for the forecast report.
- Edit Targeting: Select parameters for forecasting.
- Associate Audience Segments
- Custom Audiences
- Third Party Audiences
- Contextual Audiences
- ART Audiences
- See Boolean Logic for more details on any and all logic for targeting between groups.
- Run the report and wait a couple of minutes for results to populate.
Understanding the Results
Summary Metrics
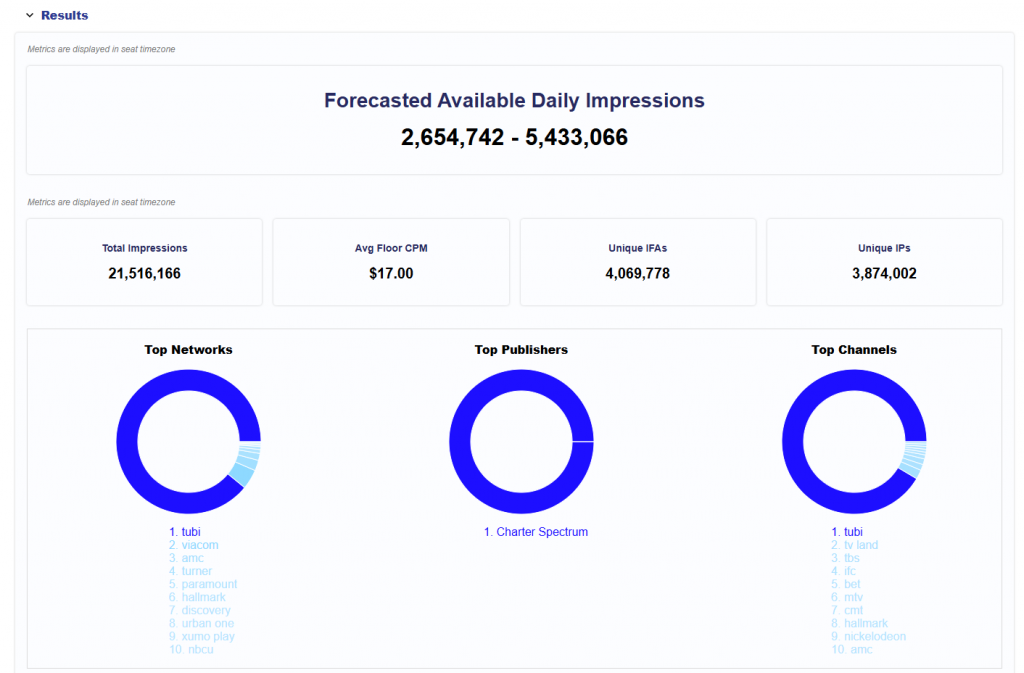
- Forecasted Available Daily Impressions: Range of estimated daily impressions available.
- Total Impressions: Estimated total impressions available over a 30-day period.
- Avg Floor CPM: The average floor CPM for the inventory included in the report.
- Unique IFAs: The estimated number of unique device identifiers available.
- Unique IPs: The estimated number of unique households available, based on IP address.
- Top Networks: Pie chart showing the most popular networks. Hover over each section to view the number of impressions over the 30-day period.
- Top Publishers: Pie chart showing the most popular networks. Hover over each section to view the number of impressions over the 30-day period.
Top Channels: Pie chart showing the most popular channels. Hover over each section to view the number of impressions over the 30-day period.
The report includes individual sections for the following:
- Exchanges
- Deals
- Channel
- Network
- Publisher
- Genre
- Series
- Titles
- Apps
- Device Types
- Livestream
- Zip Codes
- Sample Requests: Provides deeper insights into impression-level parameter combinations.
- For example:
- If a specific Deal ID is selected, charts will display available Networks and Channels.
- Sample logs will illustrate how specific networks grant access to certain channels within that deal.
- For example:
Exchanges
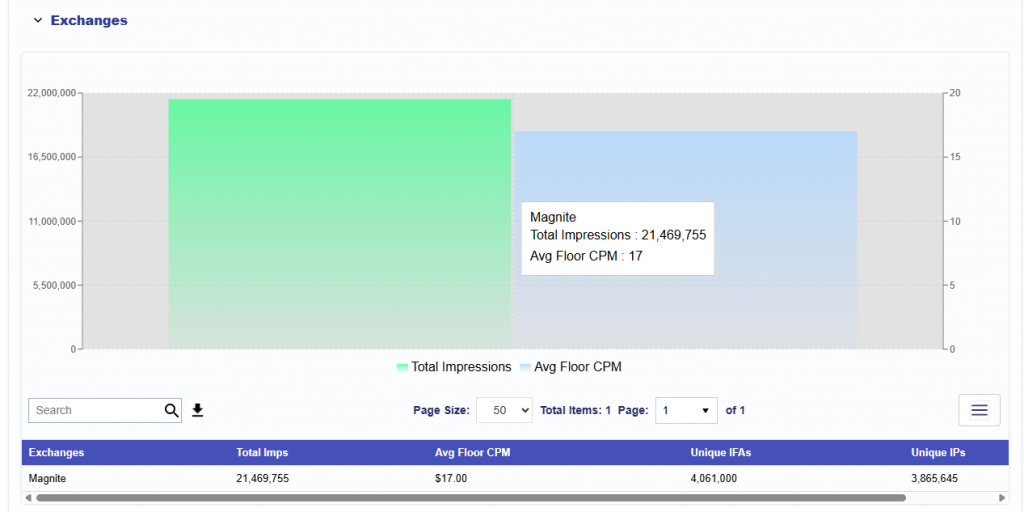
This section shows the exchanges included in the Inventory Availability report. It provides exchange-level details for Total Impressions, Avg Floor CPM, Unique IFAs, and Unique IPs.
The chart compares total impressions and average floor CPM by exchange. Hover over the chart to view the exchange name, total impressions, and average floor CPM. The table below provides the same exchange-level data in table format and can be downloaded as a CSV for further investigation.
Deals
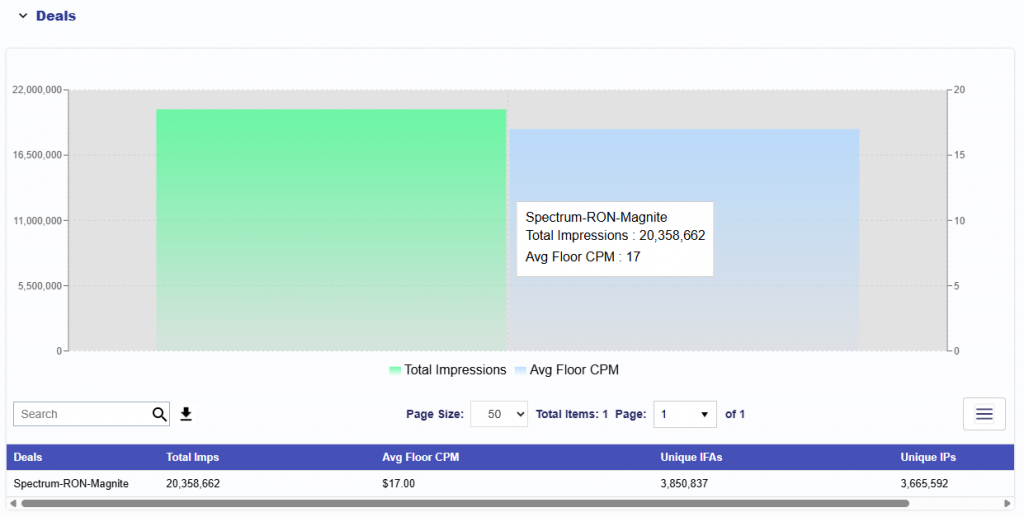
This section shows the deals included in the Inventory Availability report. It provides deal-level details for Total Impressions, Avg Floor CPM, Unique IFAs, and Unique IPs.
The chart compares total impressions and average floor CPM by deal. Hover over the chart to view the deal name, total impressions, and average floor CPM. The table below provides the same deal-level data in table format and can be downloaded as a CSV for further investigation.
Networks
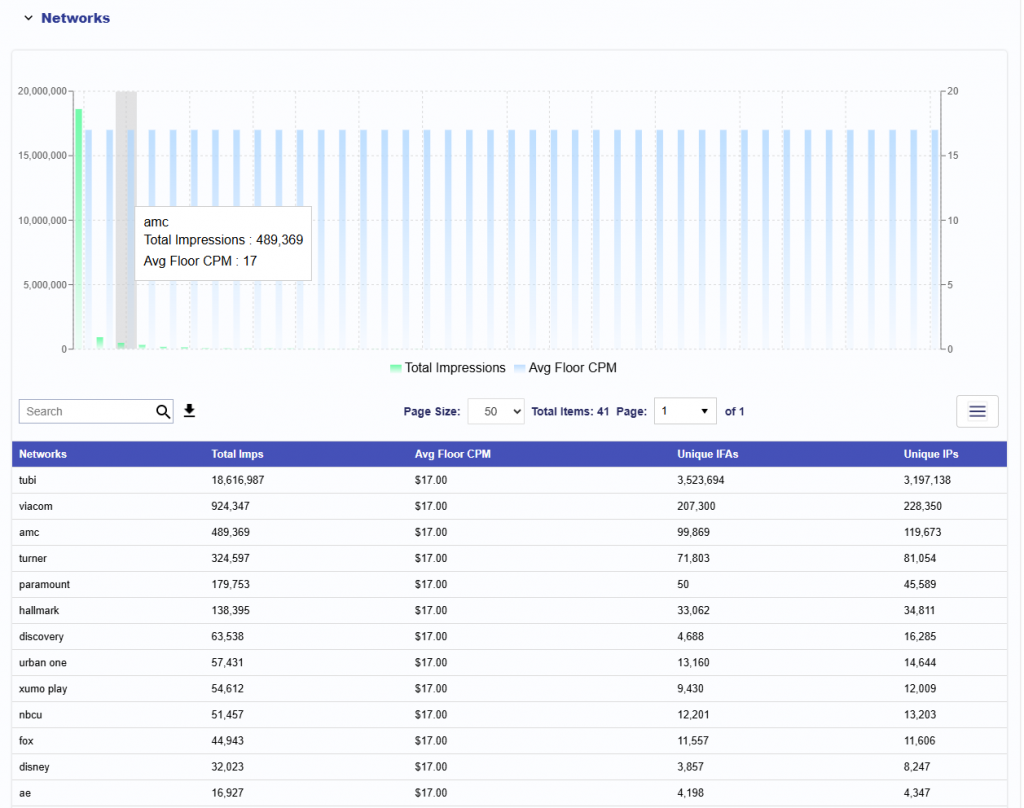
This section shows the networks included in the Inventory Availability report. It provides network-level details for Total Impressions, Avg Floor CPM, Unique IFAs, and Unique IPs.
The chart compares total impressions and average floor CPM by network. Hover over the chart to view the network name, total impressions, and average floor CPM. The table below provides the same network-level data in table format and can be downloaded as a CSV for further investigation.
Channels
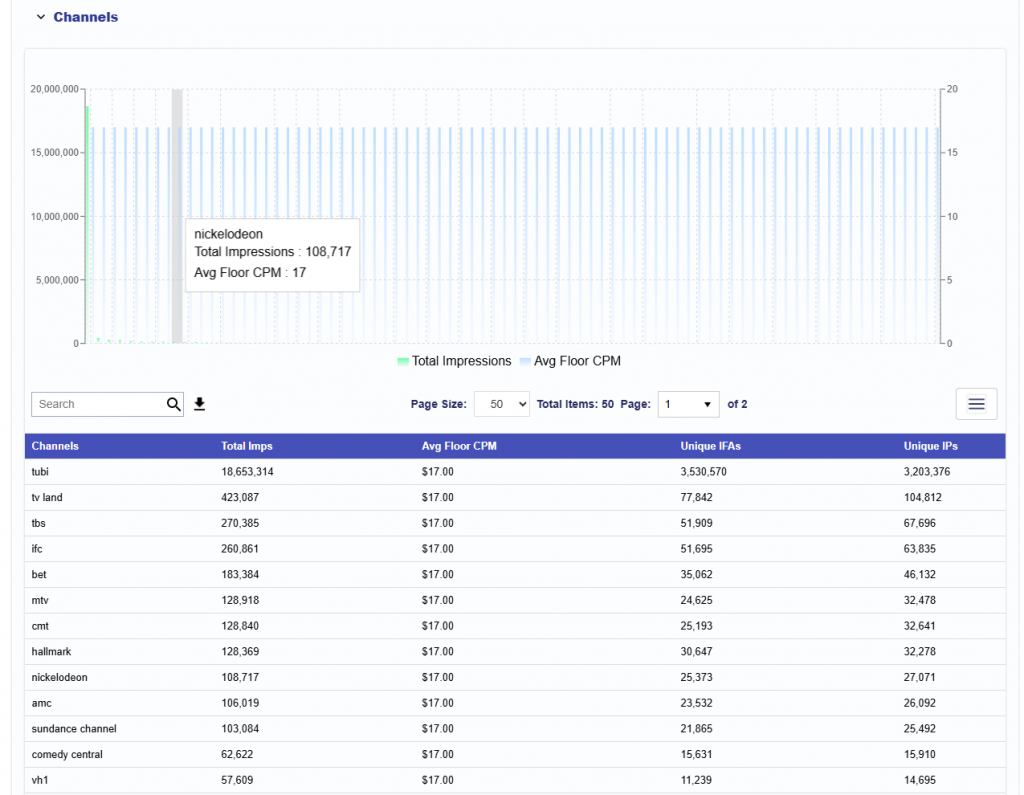
This section shows the channels included in the Inventory Availability report. It provides channel-level details for Total Impressions, Avg Floor CPM, Unique IFAs, and Unique IPs.
The chart compares total impressions and average floor CPM by channel. Hover over the chart to view the channel name, total impressions, and average floor CPM. The table below provides the same channel-level data in table format and can be downloaded as a CSV for further investigation.
Publishers
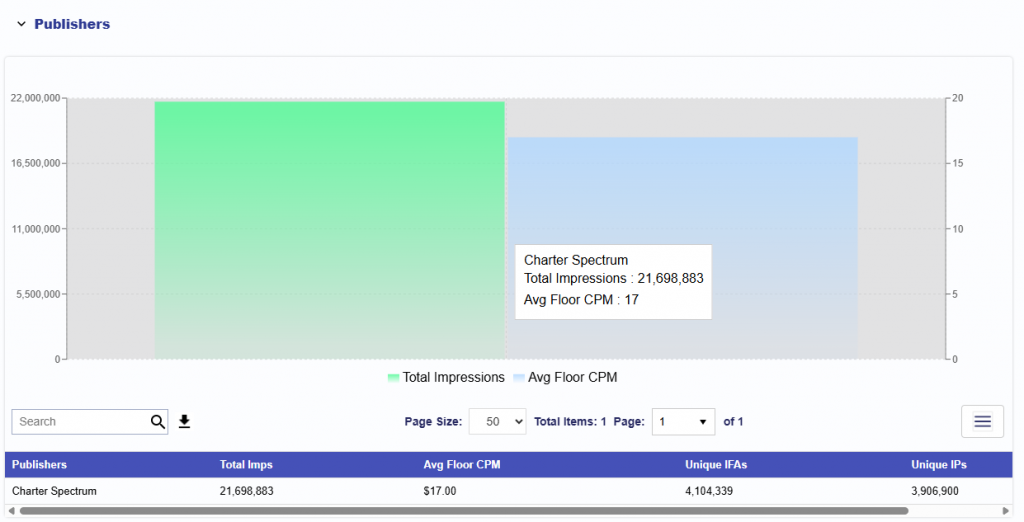
This section shows the publishers included in the Inventory Availability report. It provides publisher-level details for Total Impressions, Avg Floor CPM, Unique IFAs, and Unique IPs.
The chart compares total impressions and average floor CPM by publishers. Hover over the chart to view the publisher name, total impressions, and average floor CPM. The table below provides the same publisher-level data in table format and can be downloaded as a CSV for further investigation.
Series
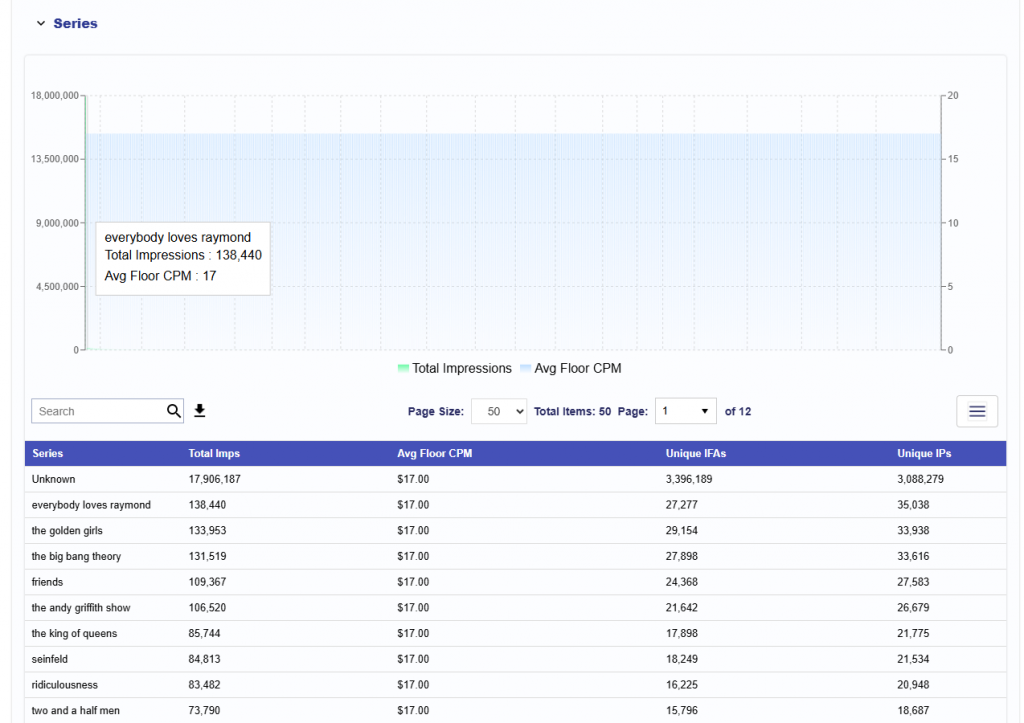
This section shows the series included in the Inventory Availability report. It provides series-level details for Total Impressions, Avg Floor CPM, Unique IFAs, and Unique IPs.
The chart compares total impressions and average floor CPM by series. Hover over the chart to view the series name, total impressions, and average floor CPM. The table below provides the same series-level data in table format and can be downloaded as a CSV for further investigation.
Titles
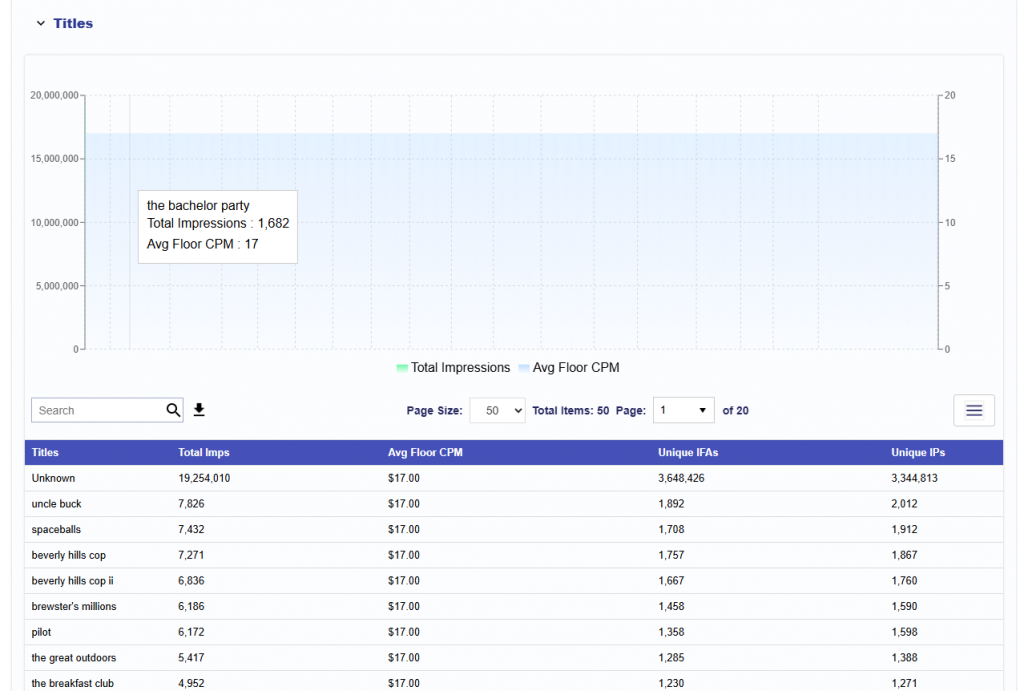
This section shows the titles included in the Inventory Availability report. It provides title-level details for Total Impressions, Avg Floor CPM, Unique IFAs, and Unique IPs.
The chart compares total impressions and average floor CPM by title. Hover over the chart to view the title name, total impressions, and average floor CPM. The table below provides the same title-level data in table format and can be downloaded as a CSV for further investigation.
Genre
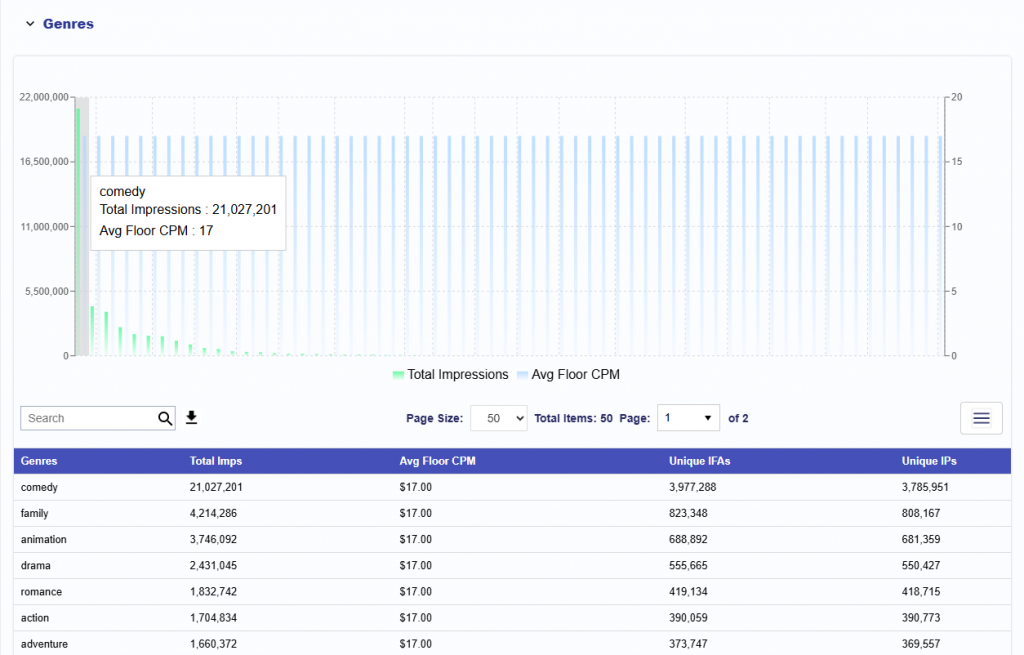
This section shows the genres included in the Inventory Availability report. It provides genre-level details for Total Impressions, Avg Floor CPM, Unique IFAs, and Unique IPs.
The chart compares total impressions and average floor CPM by genre. Hover over the chart to view the genre name, total impressions, and average floor CPM. The table below provides the same genre-level data in table format and can be downloaded as a CSV for further investigation.
Livestream
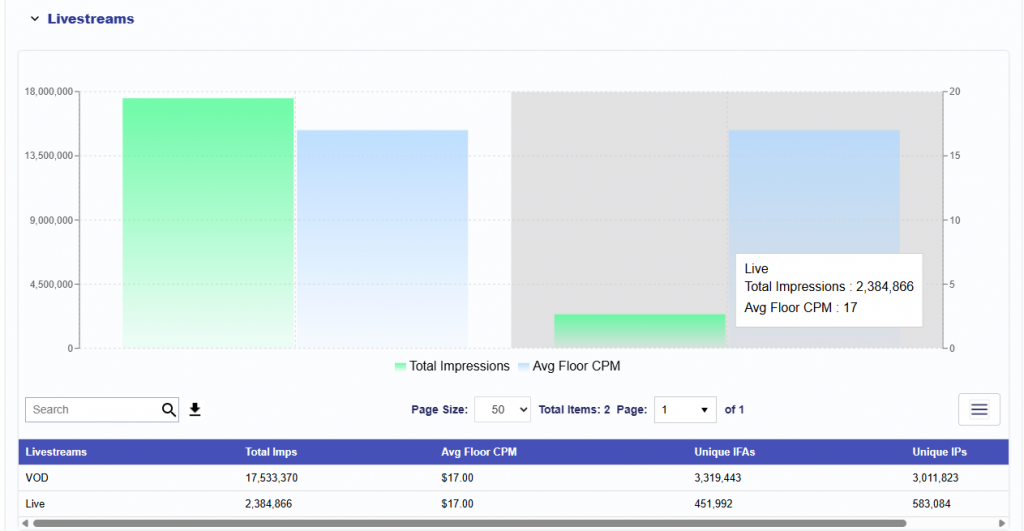
This section shows the livestream categories included in the Inventory Availability report. It provides livestream-level details for Total Impressions, Avg Floor CPM, Unique IFAs, and Unique IPs.
The chart compares total impressions and average floor CPM by livestream category. Hover over the chart to view the category name, total impressions, and average floor CPM. The table below provides the same livestream-level data in table format and can be downloaded as a CSV for further investigation.
Apps
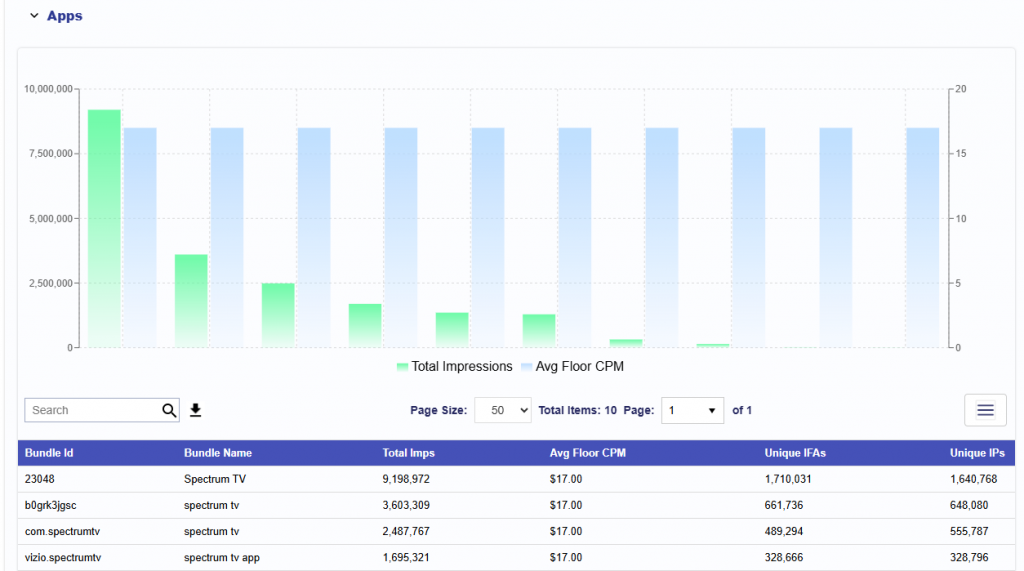
This section shows the App Bundle ID and Name included in the Inventory Availability report. It provides app-level details for Total Impressions, Avg Floor CPM, Unique IFAs, and Unique IPs.
The chart compares total impressions and average floor CPM by app. Hover over the chart to view the app name, total impressions, and average floor CPM. The table below provides the same app-level data in table format and can be downloaded as a CSV for further investigation.
Device Types
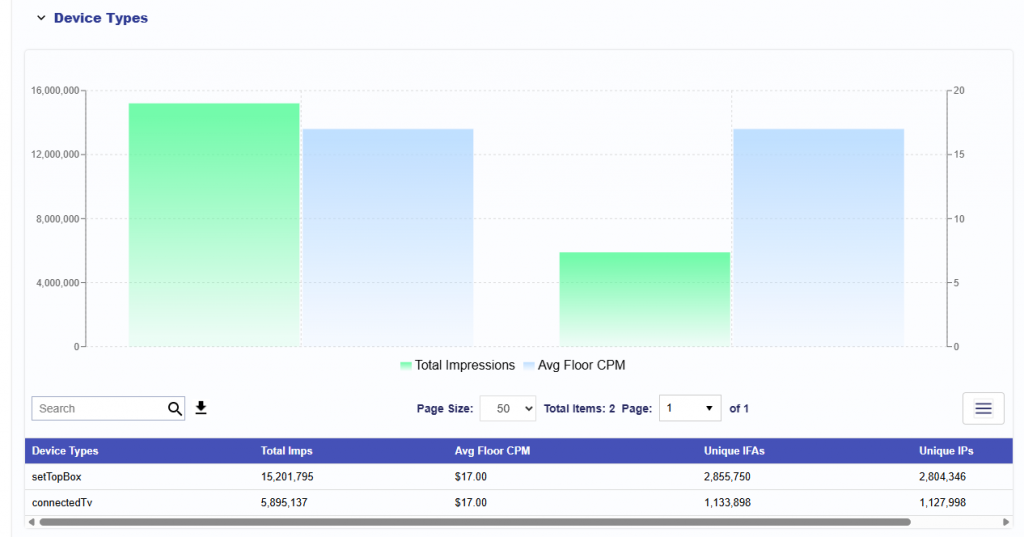
This section shows the device types included in the Inventory Availability report. It provides device type-level details for Total Impressions, Avg Floor CPM, Unique IFAs, and Unique IPs.
The chart compares total impressions and average floor CPM by device type. Hover over the chart to view the device type, total impressions, and average floor CPM. The table below provides the same device type-level data in table format and can be downloaded as a CSV for further investigation.
Zip Codes
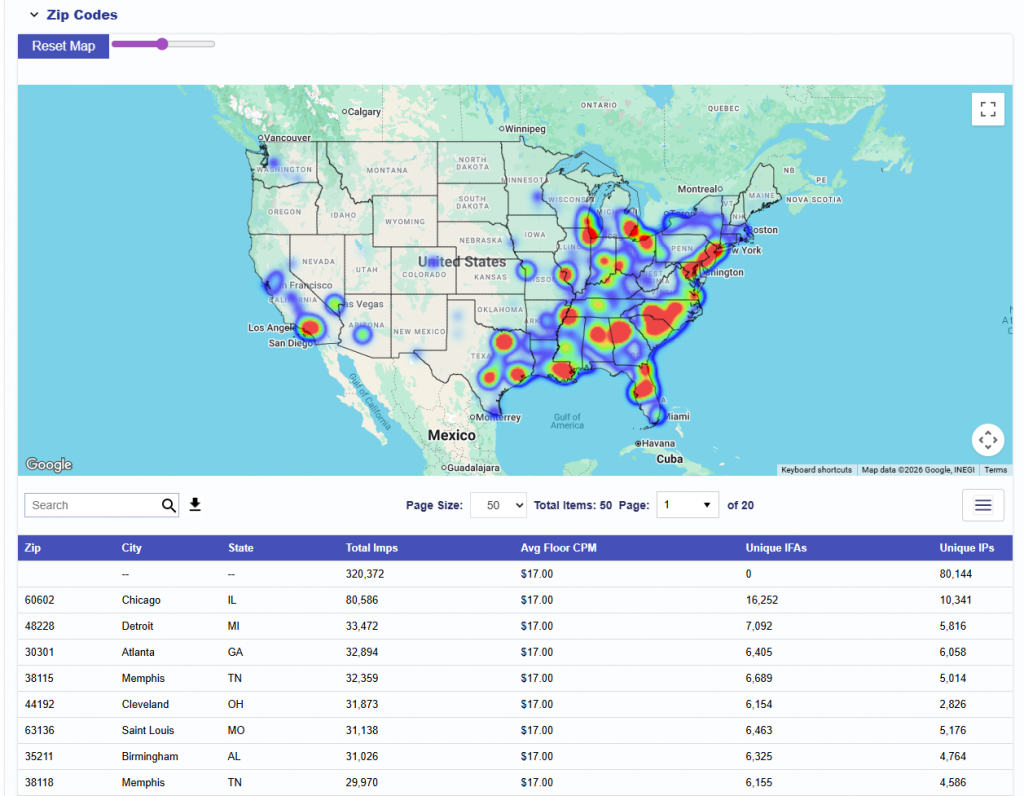
This section shows the zip codes included in the Inventory Availability report. It provides zip code-level details for City, State, Total Impressions, Avg Floor CPM, Unique IFAs, and Unique IPs.
The map displays inventory availability by zip code, with higher-density areas highlighted. Use the map controls to zoom, adjust the view, or reset the map. The table below provides the same zip code-level data in table format and can be downloaded as a CSV for further investigation.
Sample Requests
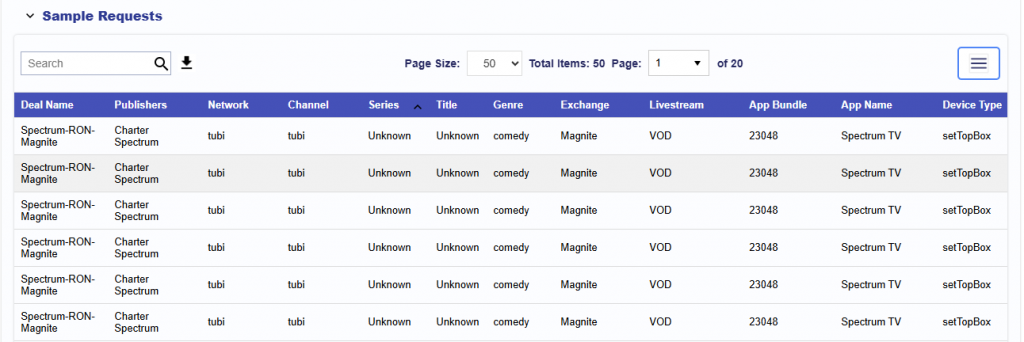
This section shows the Deal level Sample Requests included in the Inventory Availability report. It provides Deal Name, Publishers, Network, Channel, Series, Title , Genre, Exchange, Livestream, App Bundle, App Name, Device Type, Zip Code, and Impressions.
The table can be downloaded as a CSV for further review or investigation.