The Pontiac premium video deal catalog can be found in the ‘Inventory’ tab of the platform, under ‘Deals’. When selecting deals that best align with your campaign goals, it is recommended to review all columns in this table to ensure your creatives meet specs, approval processes are completed, and campaigns are correctly configured to drive success. You may also want to review the Deal Landscape Tool, to understand the level of transparency in data shared by each Deal. Sample logs and forecasting reports are also available for each Deal in the ‘ART’ tab.
ID: The Deal ID assigned from Pontiac.
Name: The Deal Name that the importer assigns to the Deal.
Avails: The approximate number of available requests for that deal. This changes based on the Reporting Interval: Yesterday, 7 Days, or 30 Days.
Deal Provider: The entity with a direct relationship with Pontiac and supplies the external deal ID used to import the deal.
Brand: The brand or publisher of the content in the deal.
Content Type: The category of content being streamed when the ad is shown. Run of Network (RON) means all inventory from the publisher or deal provider.
Media Type: The type of media: Streaming/CTV (TV placements), OLV (online video – in-app/web, not streaming TV), Combined Video, Audio, Display.
Exchanges: The SSP or platform the deal provider uses to send bid requests to Pontiac.
Floor Price: The minimum bid price (CPM) required to enter the auction. Hover over the price to see Min, Max, Avg, and Median for Bid insight.
Recommended Bid: Suggested bids based on factors like inventory variation and competition.
Livestream: The percentage breakdown of sample requests across live content, video on demand (VOD) content, or unknown environments.
Duration: Allowed ad unit durations; multiple durations show the percentage of requests for each.
Sizes: The allowed ad unit sizes; hovering over the size tool shows request percentages per size.
Auction Type:
First Price: The winning bid is the price the advertiser pays.
Second Price Plus: The advertiser pays $0.01 above the second-highest bid.
Device Types: The devices where impressions are served, including Connected Device, Connected TV, Set Top Box, Personal Computer, Phone, and Tablet.
Countries: The Countries that the Deal is seeing bid requests from.
Permitted Sensitive Categories: Deals that allow sensitive content to be served.
Publisher Approval Required: Deals requiring publisher approval for each ad before launch. Submit ads for approval through the Help Center.
Notes: Any additional deal requirements, restrictions, inventory, or targeting.
Start Date: When the Deal is eligible.
End Date: When the Deal is no longer eligible.
Last Served Date: The most recent date that impressions were served through the Deal.
Action: Request access to public Deals if needed. Note that all deals will be approved within 24 hours after being requested.
Creative Types: Shows which creative formats are seen in the bid requests for a specific Deal.
Inventory Type: Shows what type of inventory is seen in the bid requests for a specific Deal.
Negotiated Deals
If you can’t find the deal you need in the catalog, reach out through the Help Center. The Pontiac Partnership team may be able to negotiate a deal for you or you can bring over your own negotiated deals. Any programmatic guaranteed deals or deals negotiated for a specific advertiser will appear under the ‘Negotiated Deals’ section in the ‘Inventory’ tab. See how to import your own deals documentation here: Import Deal
Deal Landscape Tool
The Deal Landscape tool provides transparent insights into the data available for targeting and reporting across the accessible Deals through the Bidder. With great inconsistencies in the information shared by each media owner across the industry, this tool can be leveraged in the research and planning process to align campaign goals and expectations with available targeting and reporting capabilities.
The Transparency Report aggregates bid request data to show how much information each deal provides, including fields such as Title, Series, Channel, Network, and Full IP.
This allows you to understand exactly what data is available for targeting and reporting.
View all bidder-specific deals your account has access to
Sort by any field to evaluate transparency levels
Download the full dataset using the arrow next to the search bar
Share results via a public link (valid for 30 days)
Deal Sample Logs
Click the Deal Name to view sample logs and see exactly what data is being passed.
This allows you to:
Analyze content details such as publisher, network, channel, series, and title
Optimize targeting based on real inventory signals
Custom Reporting
The Custom Reporting tool allows you to generate sample request logs for deeper analysis across one or multiple deals.
Navigate to the Custom Reporting section
Click New Custom Report
Select your deal(s), date range, and dimensions
Generate the report
Use the Deal Landscape Tool to understand inventory, evaluate transparency, and make smarter, data-driven decisions before and during campaign execution.
Inventory Availability Tool
The Inventory Availability Tool is a forecasting tool that provides directional guidance in Campaign planning. If your report returns no data, reach out through the Help Center for more information on the feasibility and potential scale for the selected targeting. By leveraging historical data, delivery trends, sample log data, and Pontiac’s proprietary forecasting formula, the tool helps advertisers:
Create and refine Inventory targeting lists.
Assess the feasibility of targeting parameters.
Optimize bid strategies.
Estimate potential scale for Campaign planning.
Create an Inventory Availability Report
Switch to the ‘ART’ section using the toggle in the top right corner.
If the ‘ART’ button is unavailable, contact Pontiac Support via the Help Center.
Navigate to the ‘Inventory Availability’ tab.
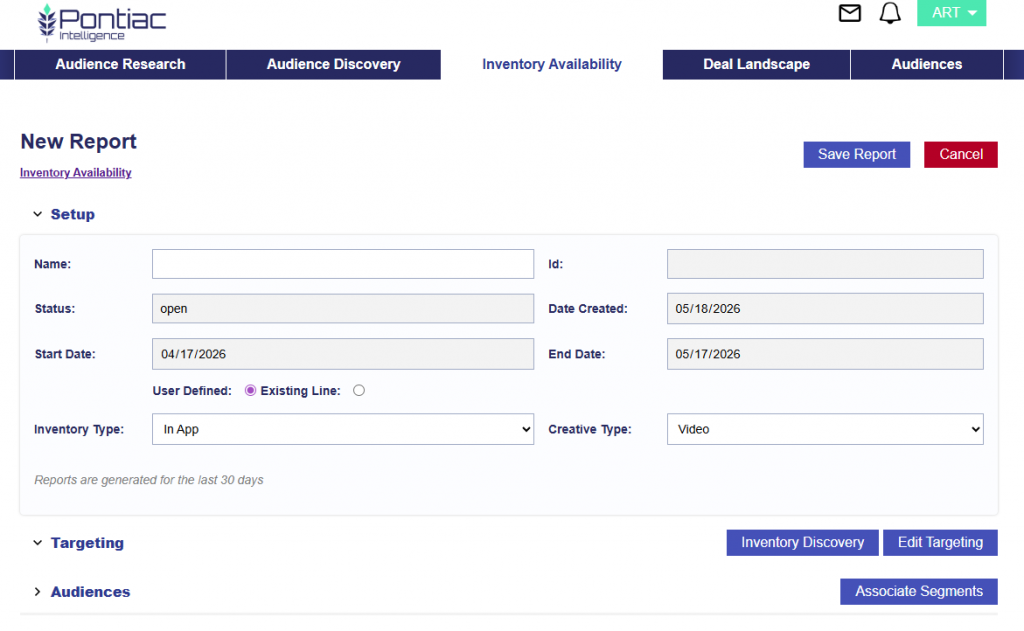
Click ‘New Report’.
The start date and end date default to 30 days before today’s date.
Select how the report is built:
User Defined: Configure the report from scratch. This is great for when you’re gather precampaign insights.
Existing Line: Configure the report based on an existing line that is already set up. This is helpful for QAing campaign set up and delivery issues. When selected, the report is generated using the line’s current configuration, including:
Inventory type
Creative type
Advertiser
Campaign
Line
Effective targeting (Intersection of the Campaign and Line)
Audiences (only Line level)
If audiences are applied to the Campaign level, users can manually add an additional group and then run the report, but it will not be automatically included.
Select Inventory Type: In App, Web or Combined.
Select the Creative Type: Video, Audio, or Banner.
Only one creative type can be selected per report. If you need to run the same report for different creative types, clone the original report and update the creative type.
Add Targeting parameters by the follow two methods
Edit Targeting: Select parameters for forecasting.
Available targeting options for In App include:
Deals
Exchanges
Geo (Country, Regions, DMAs)
Zip Codes
Livestream
App Lists
Apps
Device Types
Channel
Network
Publisher
Genre
Series
Title
Multi Field
Available targeting options for Web include:
Deals
Exchanges
Geo (Country, Regions, DMAs)
Zip Codes
Livestream
Publisher
Site Lists
Sites
Device Types
Available targeting options for Combined include:
Deals
Exchanges
Geo (Country, Regions, DMAs)
Zip Codes
Livestream
Publisher
Deal Lists
Device Types
Site Lists
Sites
App Lists
Apps
Channel
Network
Publisher
Genre
Series
Title
Multifield
Inventory Discovery: Due to the inconsistency in how inventory information is structured across the CTV landscape, this tool helps advertisers create well-informed targeting lists and identify variations in formatting for the desired inventory.
Search and click to add fields to targeting for the forecast report.
Associate Audience Segments
Custom Audiences
Third Party Audiences
Contextual Audiences
ART Audiences
See Boolean Logic for more details on any and all logic for targeting between groups.
Run the report and wait a couple of minutes for results to populate.
Understanding the Results
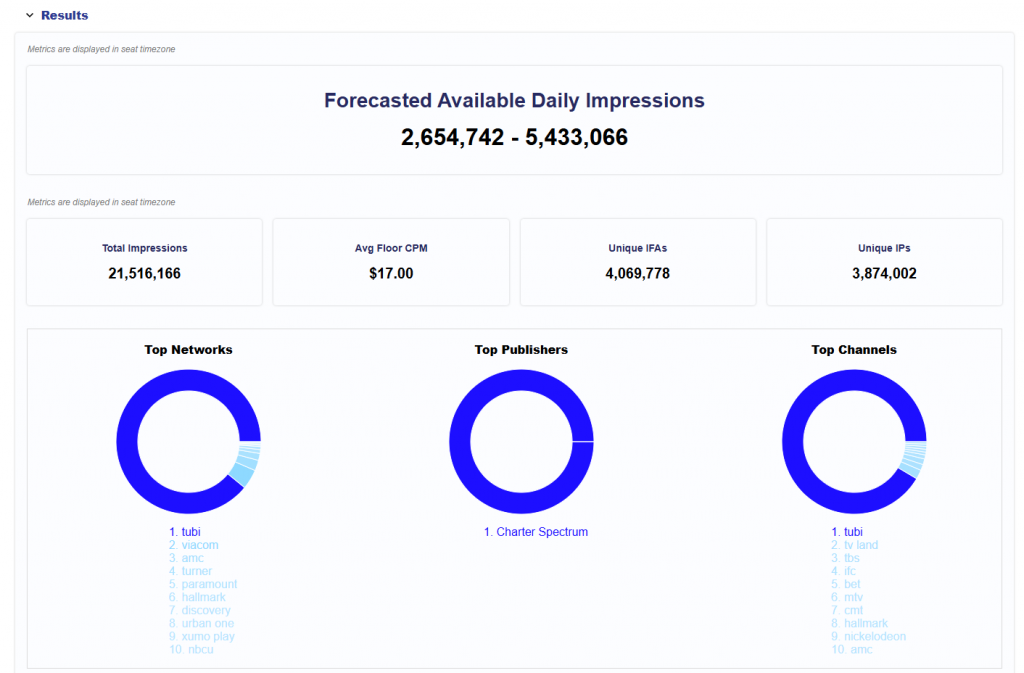
Summary Metrics
Forecasted Available Daily Impressions: Range of estimated daily impressions available.
Total Impressions: Estimated total impressions available over a 30-day period.
Avg Floor CPM: The average floor CPM for the inventory included in the report.
Unique IFAs: The estimated number of unique device identifiers available.
Unique IPs: The estimated number of unique households available, based on IP address.
Top Networks: Pie chart showing the most popular networks. Hover over each section to view the number of impressions over the 30-day period.
Top Publishers: Pie chart showing the most popular networks. Hover over each section to view the number of impressions over the 30-day period. Top Channels: Pie chart showing the most popular channels. Hover over each section to view the number of impressions over the 30-day period.
The report includes individual sections for the following:
Exchanges
Deals
Channel
Network
Publisher
Genre
Series
Titles
Apps
Device Types
Livestream
Zip Codes
Sample Requests: Provides deeper insights into impression-level parameter combinations.
For example:
If a specific Deal ID is selected, charts will display available Networks and Channels.
Sample logs will illustrate how specific networks grant access to certain channels within that deal.
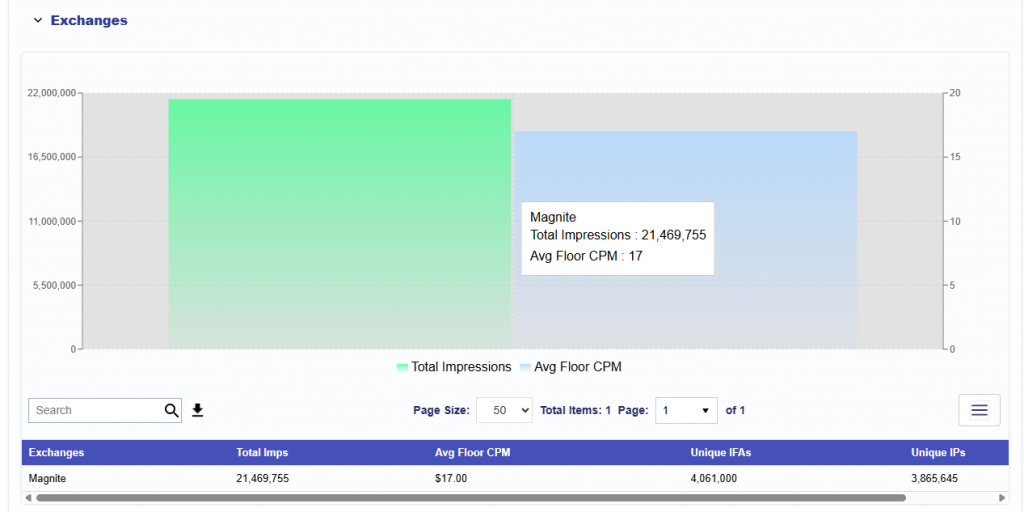
Exchanges
This section shows the exchanges included in the Inventory Availability report. It provides exchange-level details for Total Impressions, Avg Floor CPM, Unique IFAs, and Unique IPs.
The chart compares total impressions and average floor CPM by exchange. Hover over the chart to view the exchange name, total impressions, and average floor CPM. The table below provides the same exchange-level data in table format and can be downloaded as a CSV for further investigation.
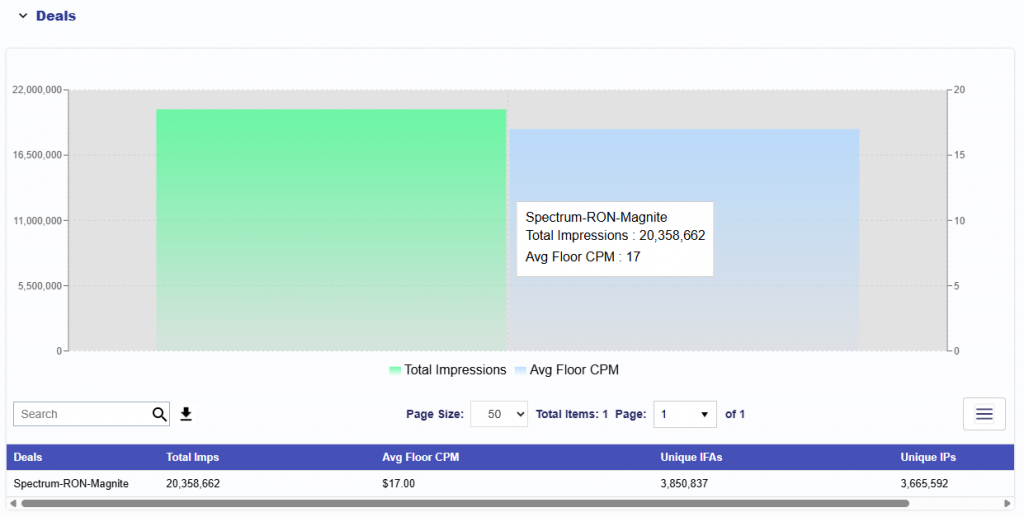
Deals
This section shows the deals included in the Inventory Availability report. It provides deal-level details for Total Impressions, Avg Floor CPM, Unique IFAs, and Unique IPs.
The chart compares total impressions and average floor CPM by deal. Hover over the chart to view the deal name, total impressions, and average floor CPM. The table below provides the same deal-level data in table format and can be downloaded as a CSV for further investigation.
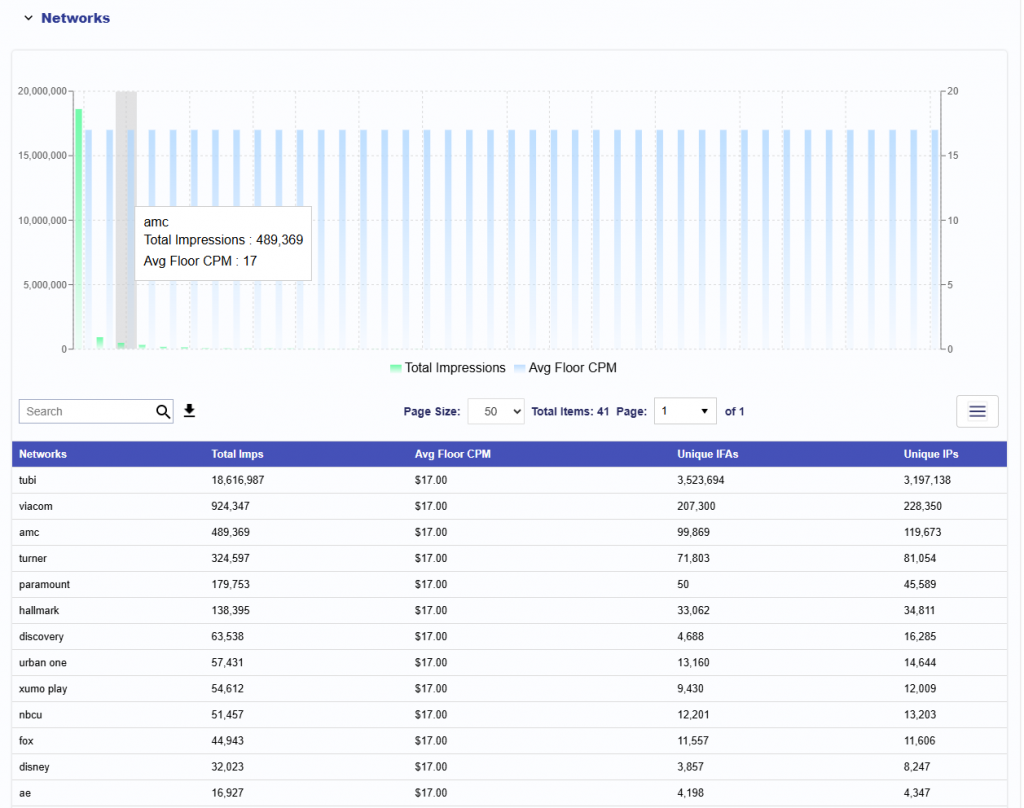
Networks
This section shows the networks included in the Inventory Availability report. It provides network-level details for Total Impressions, Avg Floor CPM, Unique IFAs, and Unique IPs.
The chart compares total impressions and average floor CPM by network. Hover over the chart to view the network name, total impressions, and average floor CPM. The table below provides the same network-level data in table format and can be downloaded as a CSV for further investigation.
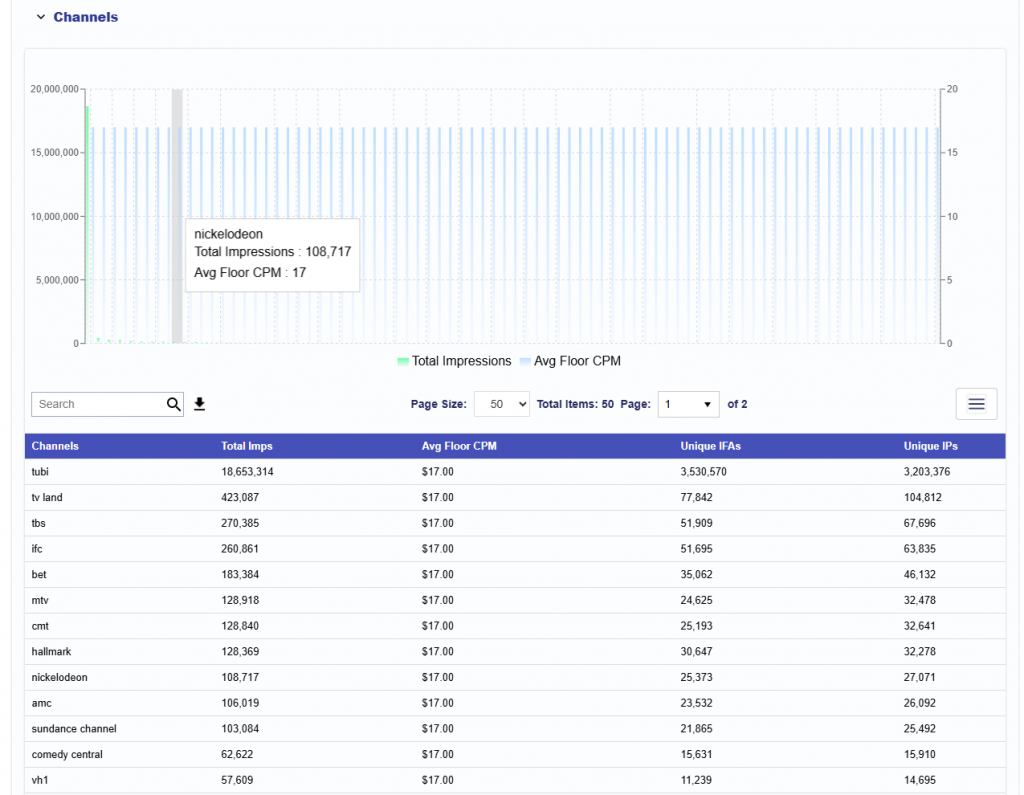
Channels
This section shows the channels included in the Inventory Availability report. It provides channel-level details for Total Impressions, Avg Floor CPM, Unique IFAs, and Unique IPs.
The chart compares total impressions and average floor CPM by channel. Hover over the chart to view the channel name, total impressions, and average floor CPM. The table below provides the same channel-level data in table format and can be downloaded as a CSV for further investigation.
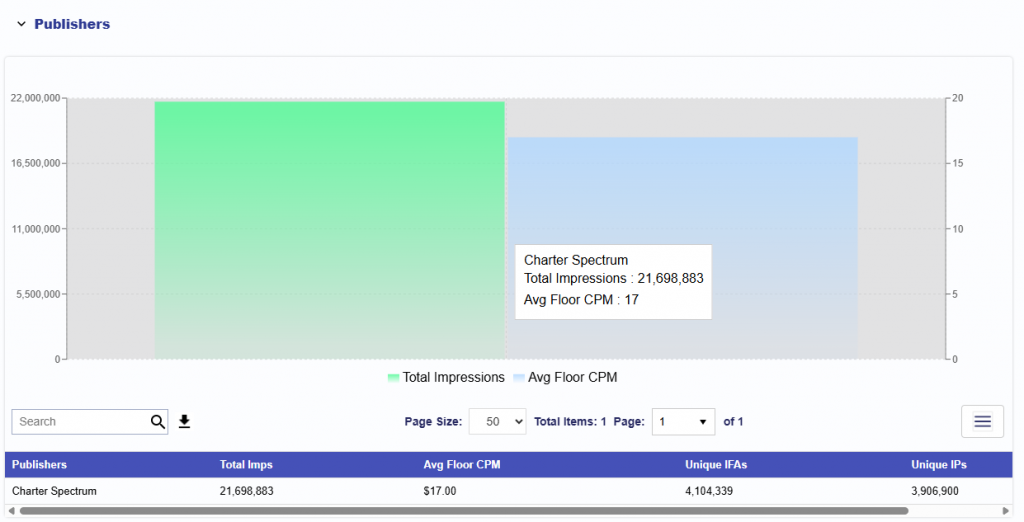
Publishers
This section shows the publishers included in the Inventory Availability report. It provides publisher-level details for Total Impressions, Avg Floor CPM, Unique IFAs, and Unique IPs.
The chart compares total impressions and average floor CPM by publishers. Hover over the chart to view the publisher name, total impressions, and average floor CPM. The table below provides the same publisher-level data in table format and can be downloaded as a CSV for further investigation.
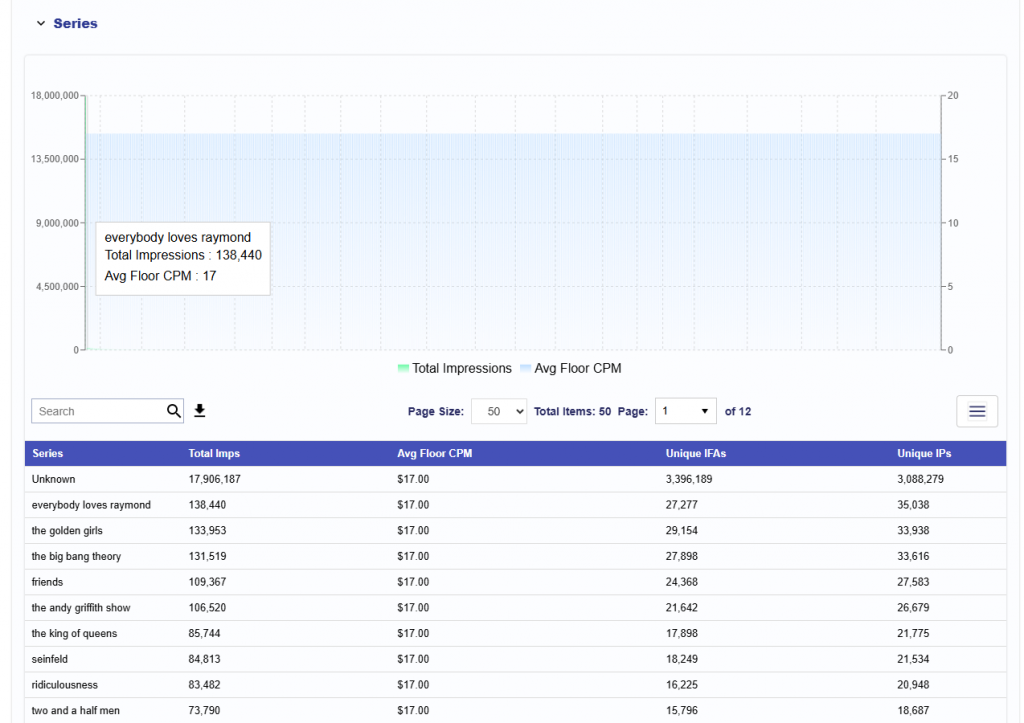
Series
This section shows the series included in the Inventory Availability report. It provides series-level details for Total Impressions, Avg Floor CPM, Unique IFAs, and Unique IPs.
The chart compares total impressions and average floor CPM by series. Hover over the chart to view the series name, total impressions, and average floor CPM. The table below provides the same series-level data in table format and can be downloaded as a CSV for further investigation.
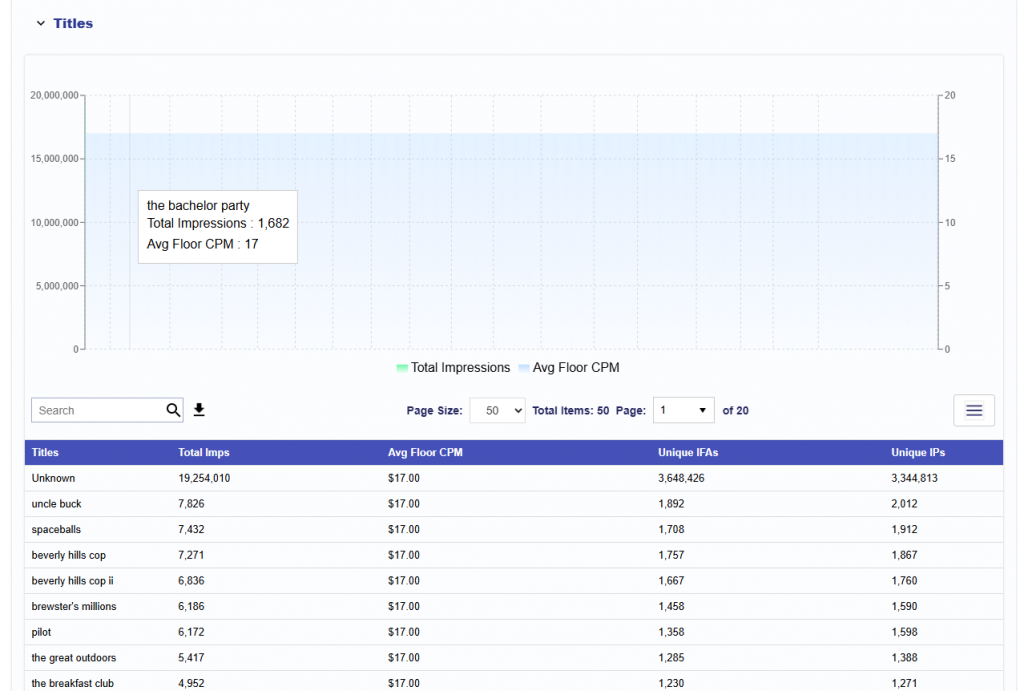
Titles
This section shows the titles included in the Inventory Availability report. It provides title-level details for Total Impressions, Avg Floor CPM, Unique IFAs, and Unique IPs.
The chart compares total impressions and average floor CPM by title. Hover over the chart to view the title name, total impressions, and average floor CPM. The table below provides the same title-level data in table format and can be downloaded as a CSV for further investigation.
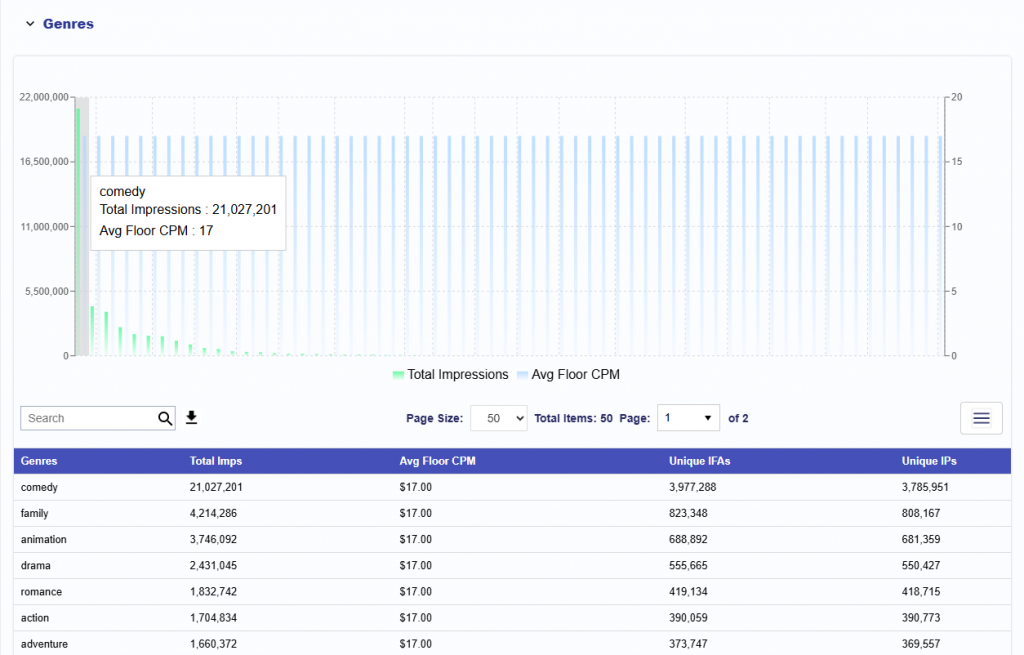
Genre
This section shows the genres included in the Inventory Availability report. It provides genre-level details for Total Impressions, Avg Floor CPM, Unique IFAs, and Unique IPs.
The chart compares total impressions and average floor CPM by genre. Hover over the chart to view the genre name, total impressions, and average floor CPM. The table below provides the same genre-level data in table format and can be downloaded as a CSV for further investigation.
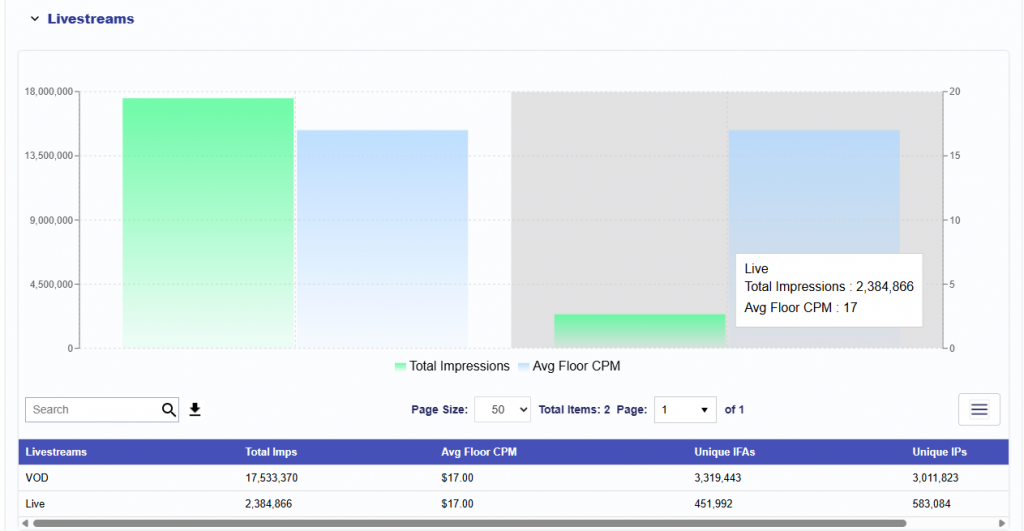
Livestream
This section shows the livestream categories included in the Inventory Availability report. It provides livestream-level details for Total Impressions, Avg Floor CPM, Unique IFAs, and Unique IPs.
The chart compares total impressions and average floor CPM by livestream category. Hover over the chart to view the category name, total impressions, and average floor CPM. The table below provides the same livestream-level data in table format and can be downloaded as a CSV for further investigation.
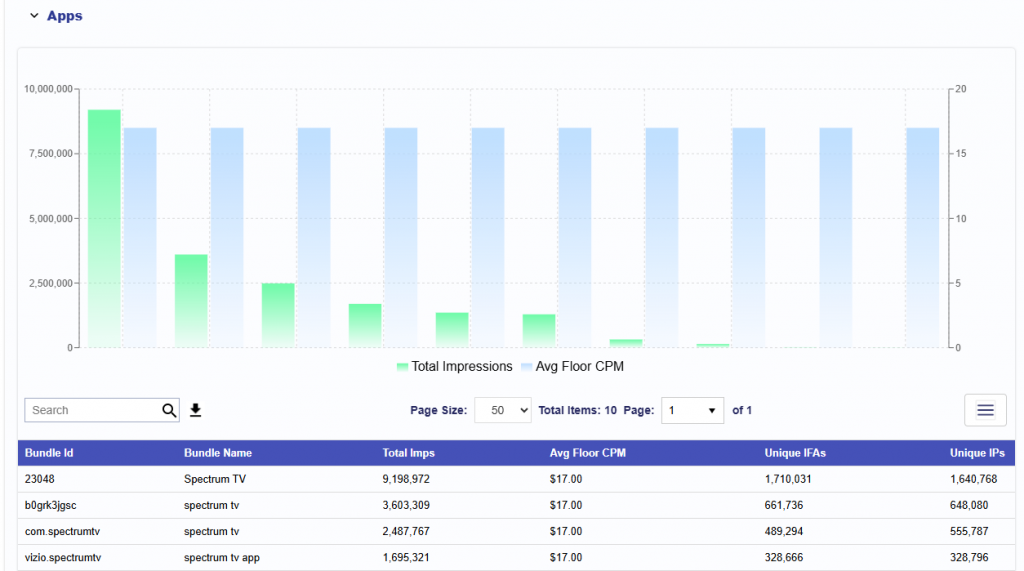
Apps
This section shows the App Bundle ID and Name included in the Inventory Availability report. It provides app-level details for Total Impressions, Avg Floor CPM, Unique IFAs, and Unique IPs.
The chart compares total impressions and average floor CPM by app. Hover over the chart to view the app name, total impressions, and average floor CPM. The table below provides the same app-level data in table format and can be downloaded as a CSV for further investigation.
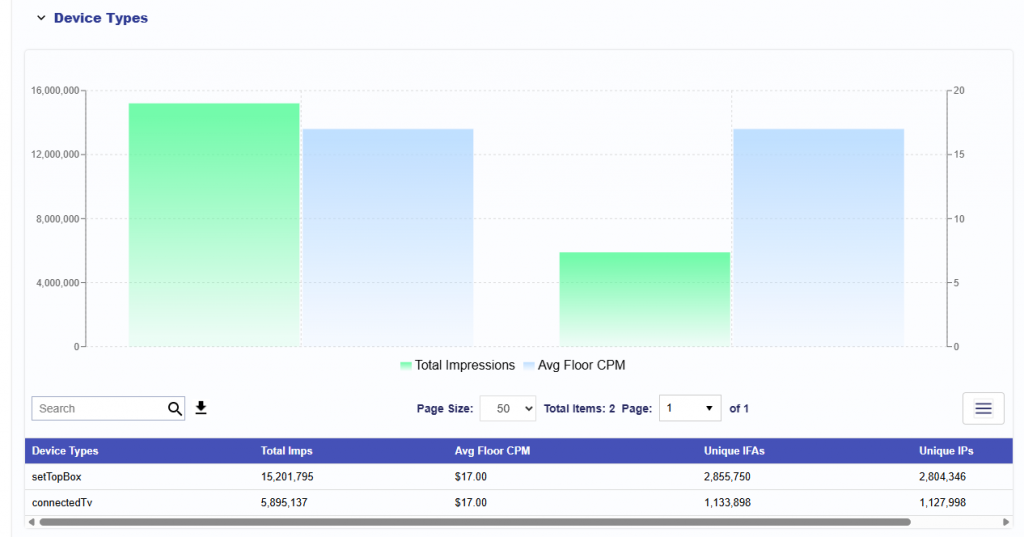
Device Types
This section shows the device types included in the Inventory Availability report. It provides device type-level details for Total Impressions, Avg Floor CPM, Unique IFAs, and Unique IPs.
The chart compares total impressions and average floor CPM by device type. Hover over the chart to view the device type, total impressions, and average floor CPM. The table below provides the same device type-level data in table format and can be downloaded as a CSV for further investigation.
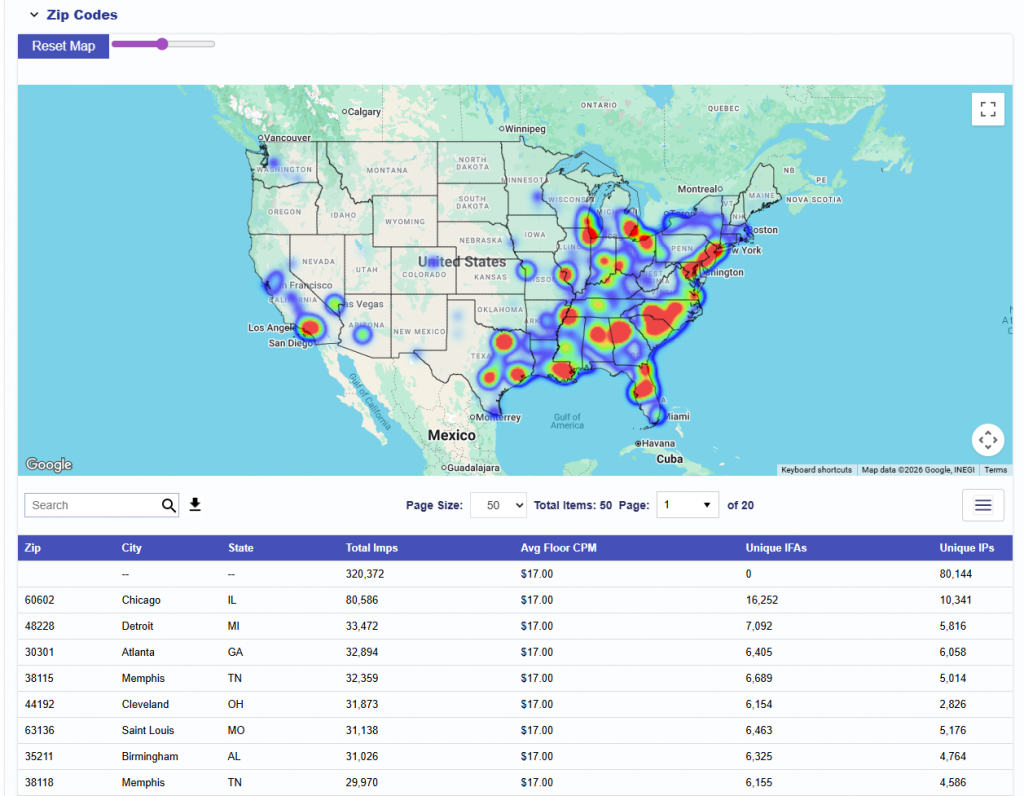
Zip Codes
This section shows the zip codes included in the Inventory Availability report. It provides zip code-level details for City, State, Total Impressions, Avg Floor CPM, Unique IFAs, and Unique IPs.
The map displays inventory availability by zip code, with higher-density areas highlighted. Use the map controls to zoom, adjust the view, or reset the map. The table below provides the same zip code-level data in table format and can be downloaded as a CSV for further investigation.
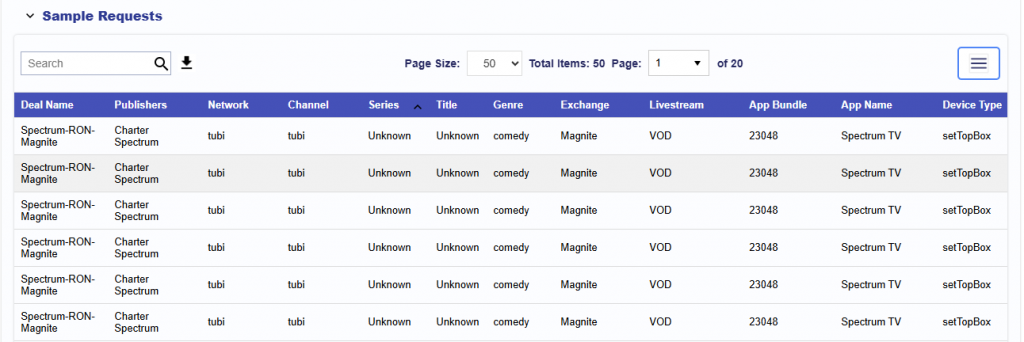
Sample Requests
This section shows the Deal level Sample Requests included in the Inventory Availability report. It provides Deal Name, Publishers, Network, Channel, Series, Title , Genre, Exchange, Livestream, App Bundle, App Name, Device Type, Zip Code, and Impressions.
The table can be downloaded as a CSV for further review or investigation.
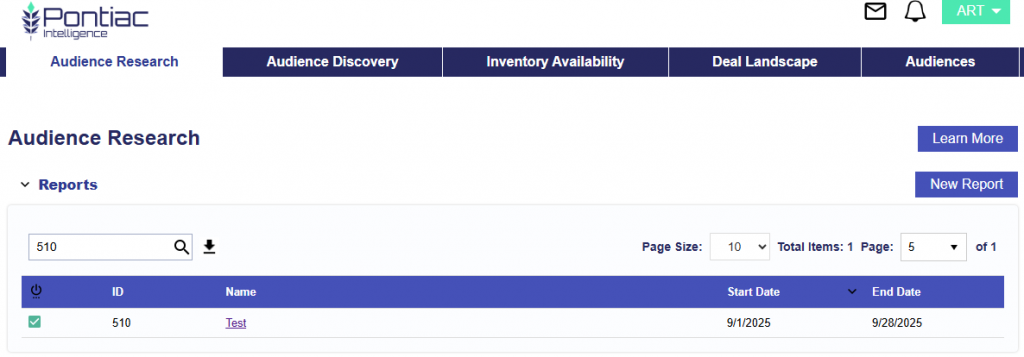
Audience Research Tool
Locate & understand the highest value users to your brand by utilizing the traffic on your website, or a list of U.S. zip codes, to create detailed insight reports, and leverage look-a-like modeling to find new targets that share key characteristics with your existing audience. For more information, please see the full ART Audience Research Tool documentation.
Audience Discovery Tool
Create your target Audience profile from the desired demographic variables to discover new zip code targets with the highest propensity match to your desired Audience profile. Leveraging the correlation between zip codes and demographics, ADT uses US Census Data to find the zip codes with the largest deviation from the US mean across the selected variables. Leveraging impression data and deep contextual analysis, interest categories can also be evaluated for each zip code to find areas that are over-indexing in content consumption for the selected topics. Audience Discovery data can be exported for targeting across all channels and media types. Additionally, browse our public reports to see if there is a report that fits your campaign needs already. For more information, please see the full ART Audience Discovery Tool documentation.