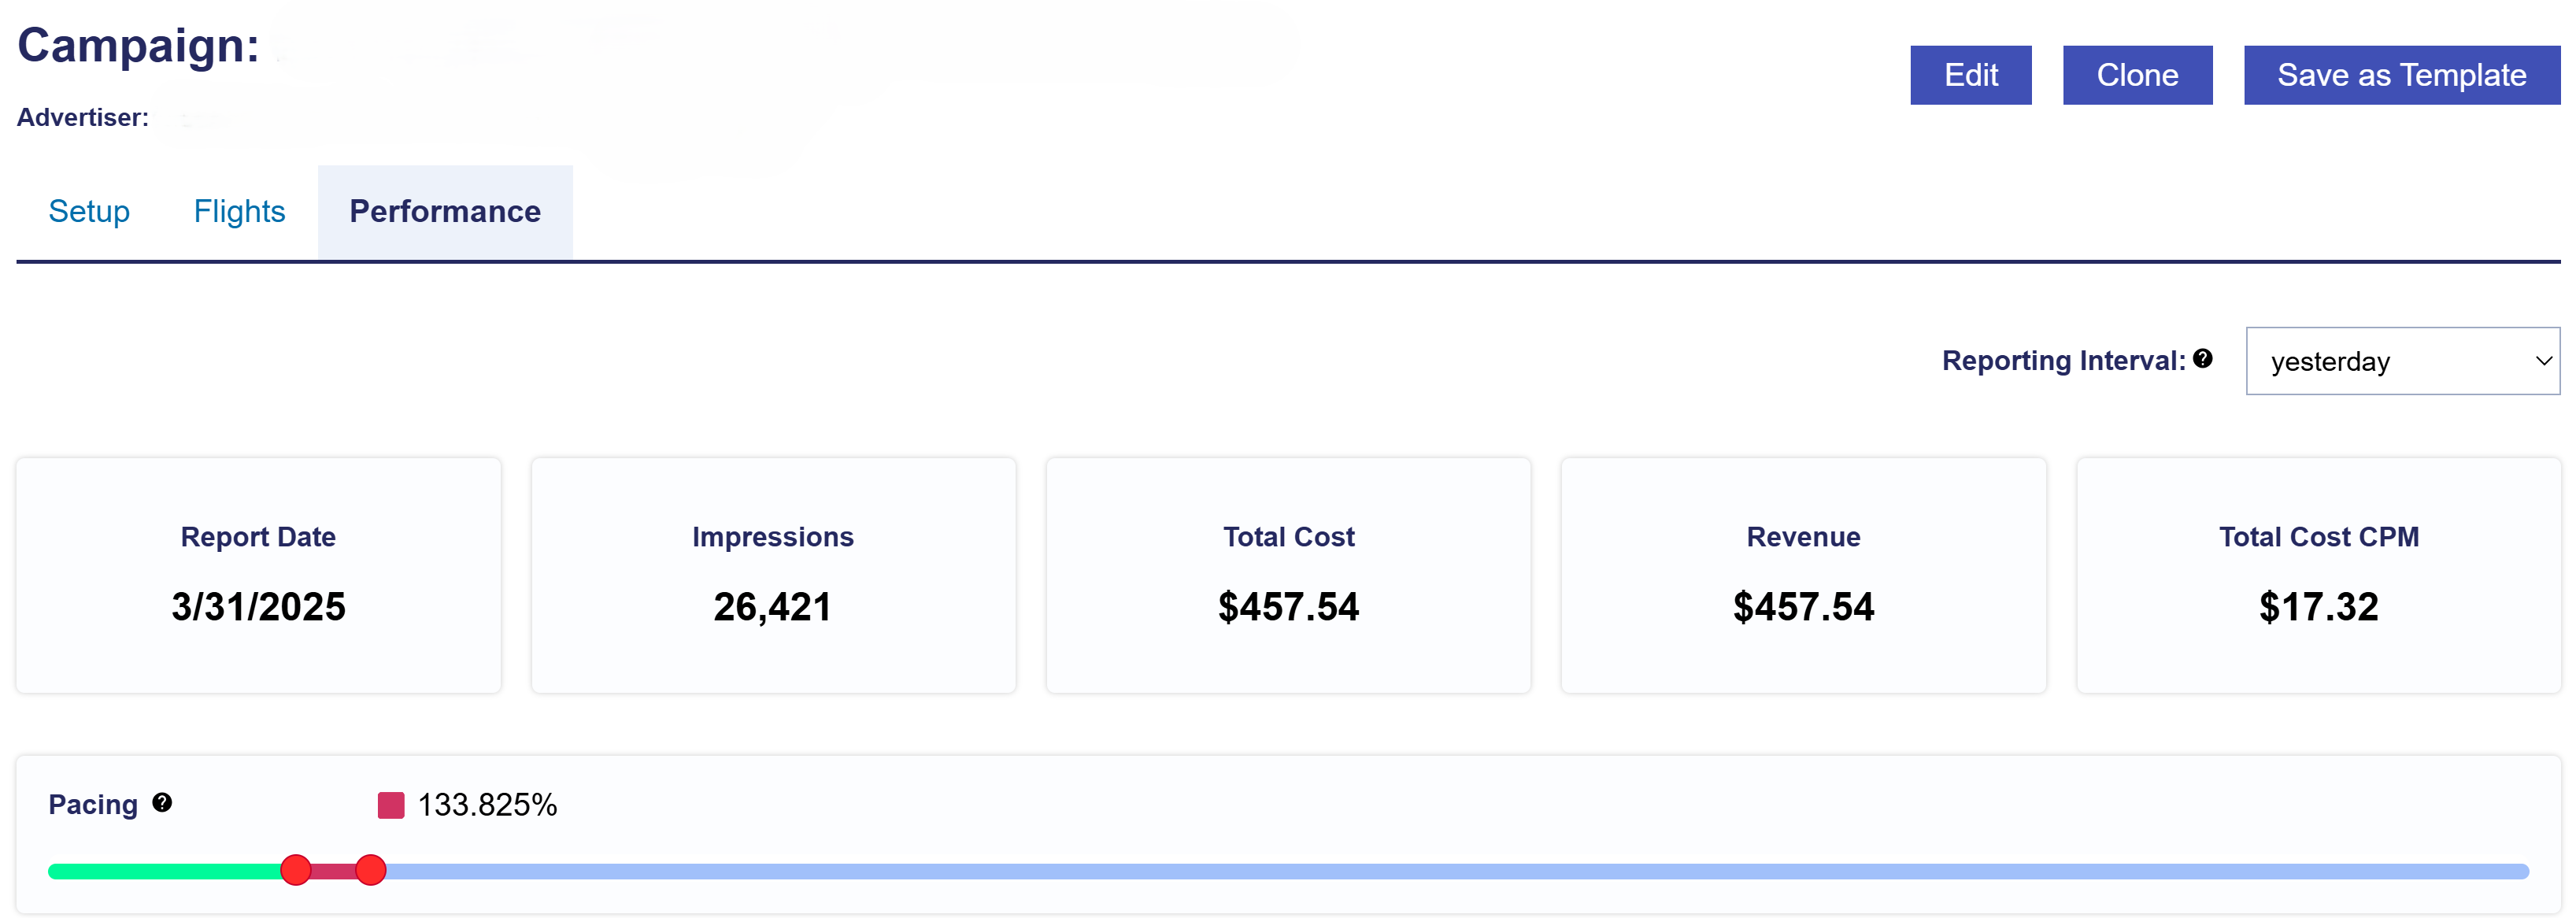
Looking at the Campaign Performance tab, you can filter the Reporting Interval to adjust the top tiles section. Note that all intervals with the exception of yesterday, include metrics from today. Today’s metrics update hourly and have a 3 hour delay. The metrics include:
Report Date: Shows the selected report date or date range.
Impressions: The total number of impressions the Campaign served within the selected reporting interval.
Total Cost: The total Campaign spend, including media costs and any applicable margins or fees.
Revenue: The total Campaign revenue.
Total Cost CPM: The total cost per thousand impressions for the Campaign, calculated as (Total Cost / Impressions) x 1,000.
Campaign Pacing: The percentage of budget the Campaign has spent compared to perfect pacing based on flight dates and budget. This will update daily and takes into account spend from start date to ‘yesterday’. Optimal pacing is between 90 – 110%.
Below the Pacing, this tab provides dropdown insights into Bid Data, Line Performance, Campaign Daily Performance, and Video Events. Continue to see each section for more details.
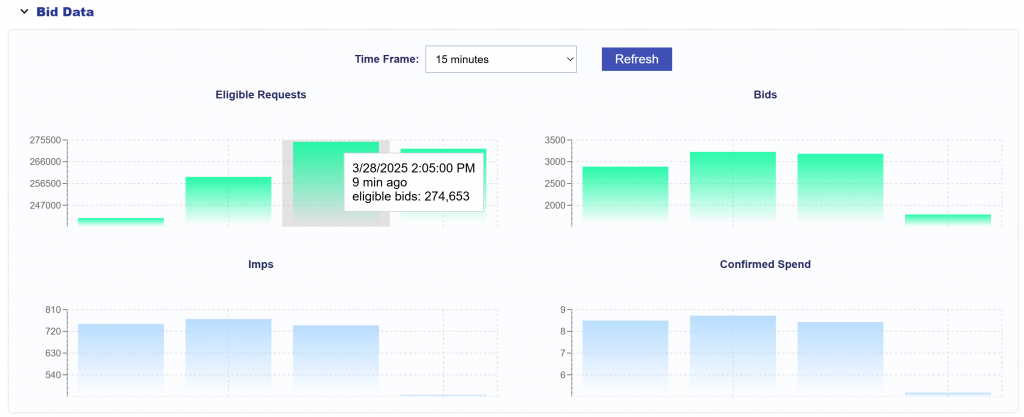
Bid Data
In the Bid Data dropdown section, the Time Frame can be adjusted to display bid data for 15 minutes, 1 hour, 12 hours, or 1 day. This section includes four charts that provide insights into the number of eligible bid requests, bids placed, impressions served, and confirmed spend for the Campaign. Hover over each bar to view the time of day, time elapsed, and the metric value for more detailed insights.
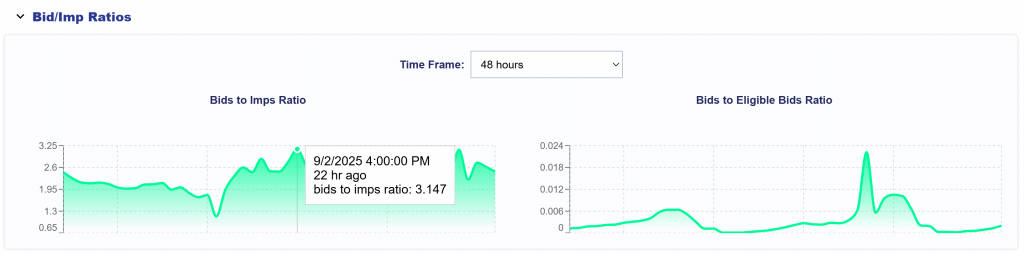
Bid/Imp Ratios
The Bid/Imp Ratios expandable section shows:
Bid-to-Impression ratio – how often bids result in impressions (delivery rate).
Bid-to-Eligible Impressions ratio – how many eligible impressions we bid on (bid rate).
Charts can be viewed in hourly increments with selectable time ranges (6, 12, 24, and 48 hours). This provides improved transparency into campaign bidding efficiency and behavior.
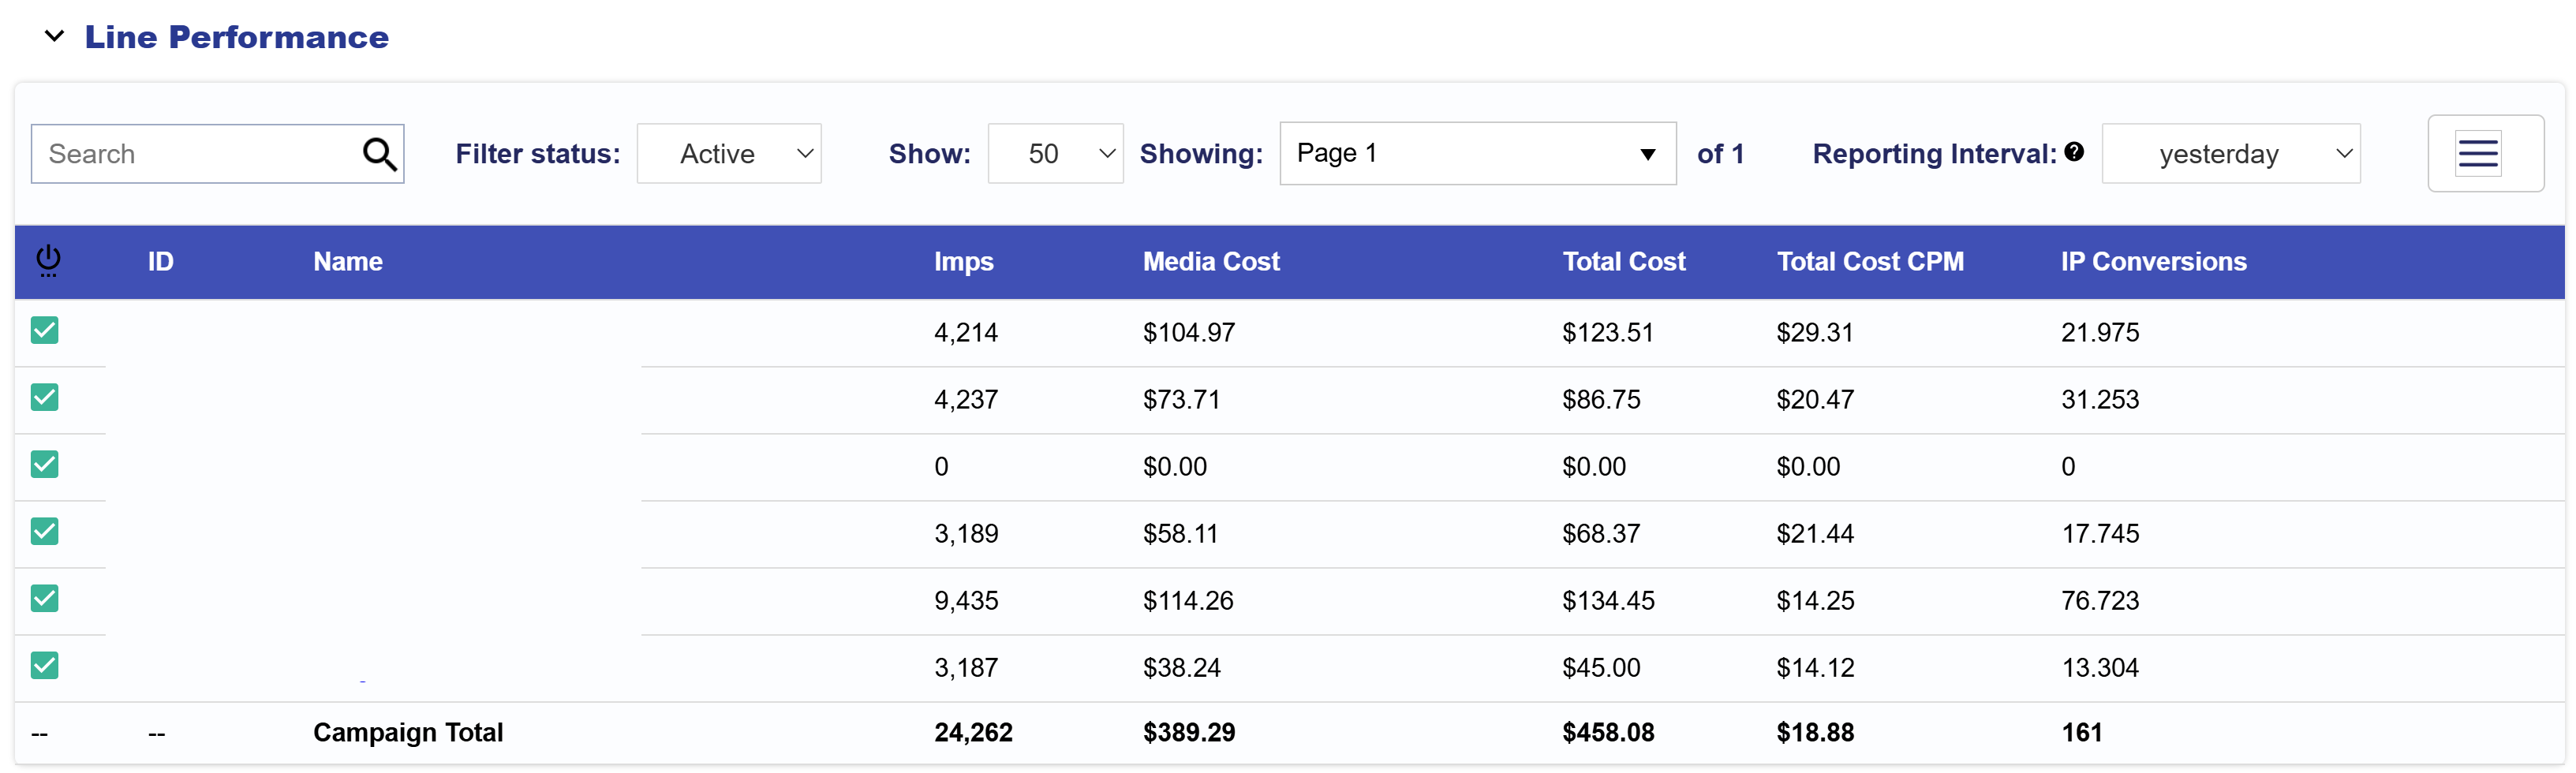
Line Performance
The Line Performance dropdown holds Line level metrics for the selected Campaign.
Below are the metrics available in this section:
Line ID
Line Name
Imps: The total number of impressions the Line served within the selected reporting interval.
Media Cost: The total dollar amount spent on the Lines media before additional fees or margins are applied.
Total Cost: The total Line spend, including media costs and any applicable margins or fees.
Total Cost CPM: The total cost per thousand impressions for the Line, calculated as (Total Cost / Impressions) x 1,000.
IP Conversions: The number of conversions attributed to users by Line who were served an ad and later converted based on IP tracking.
Note that the bottom row shows the Campaign Totals for Imps, Media Cost, Total Cost, Avg Cost CPM, and IP Conversions.
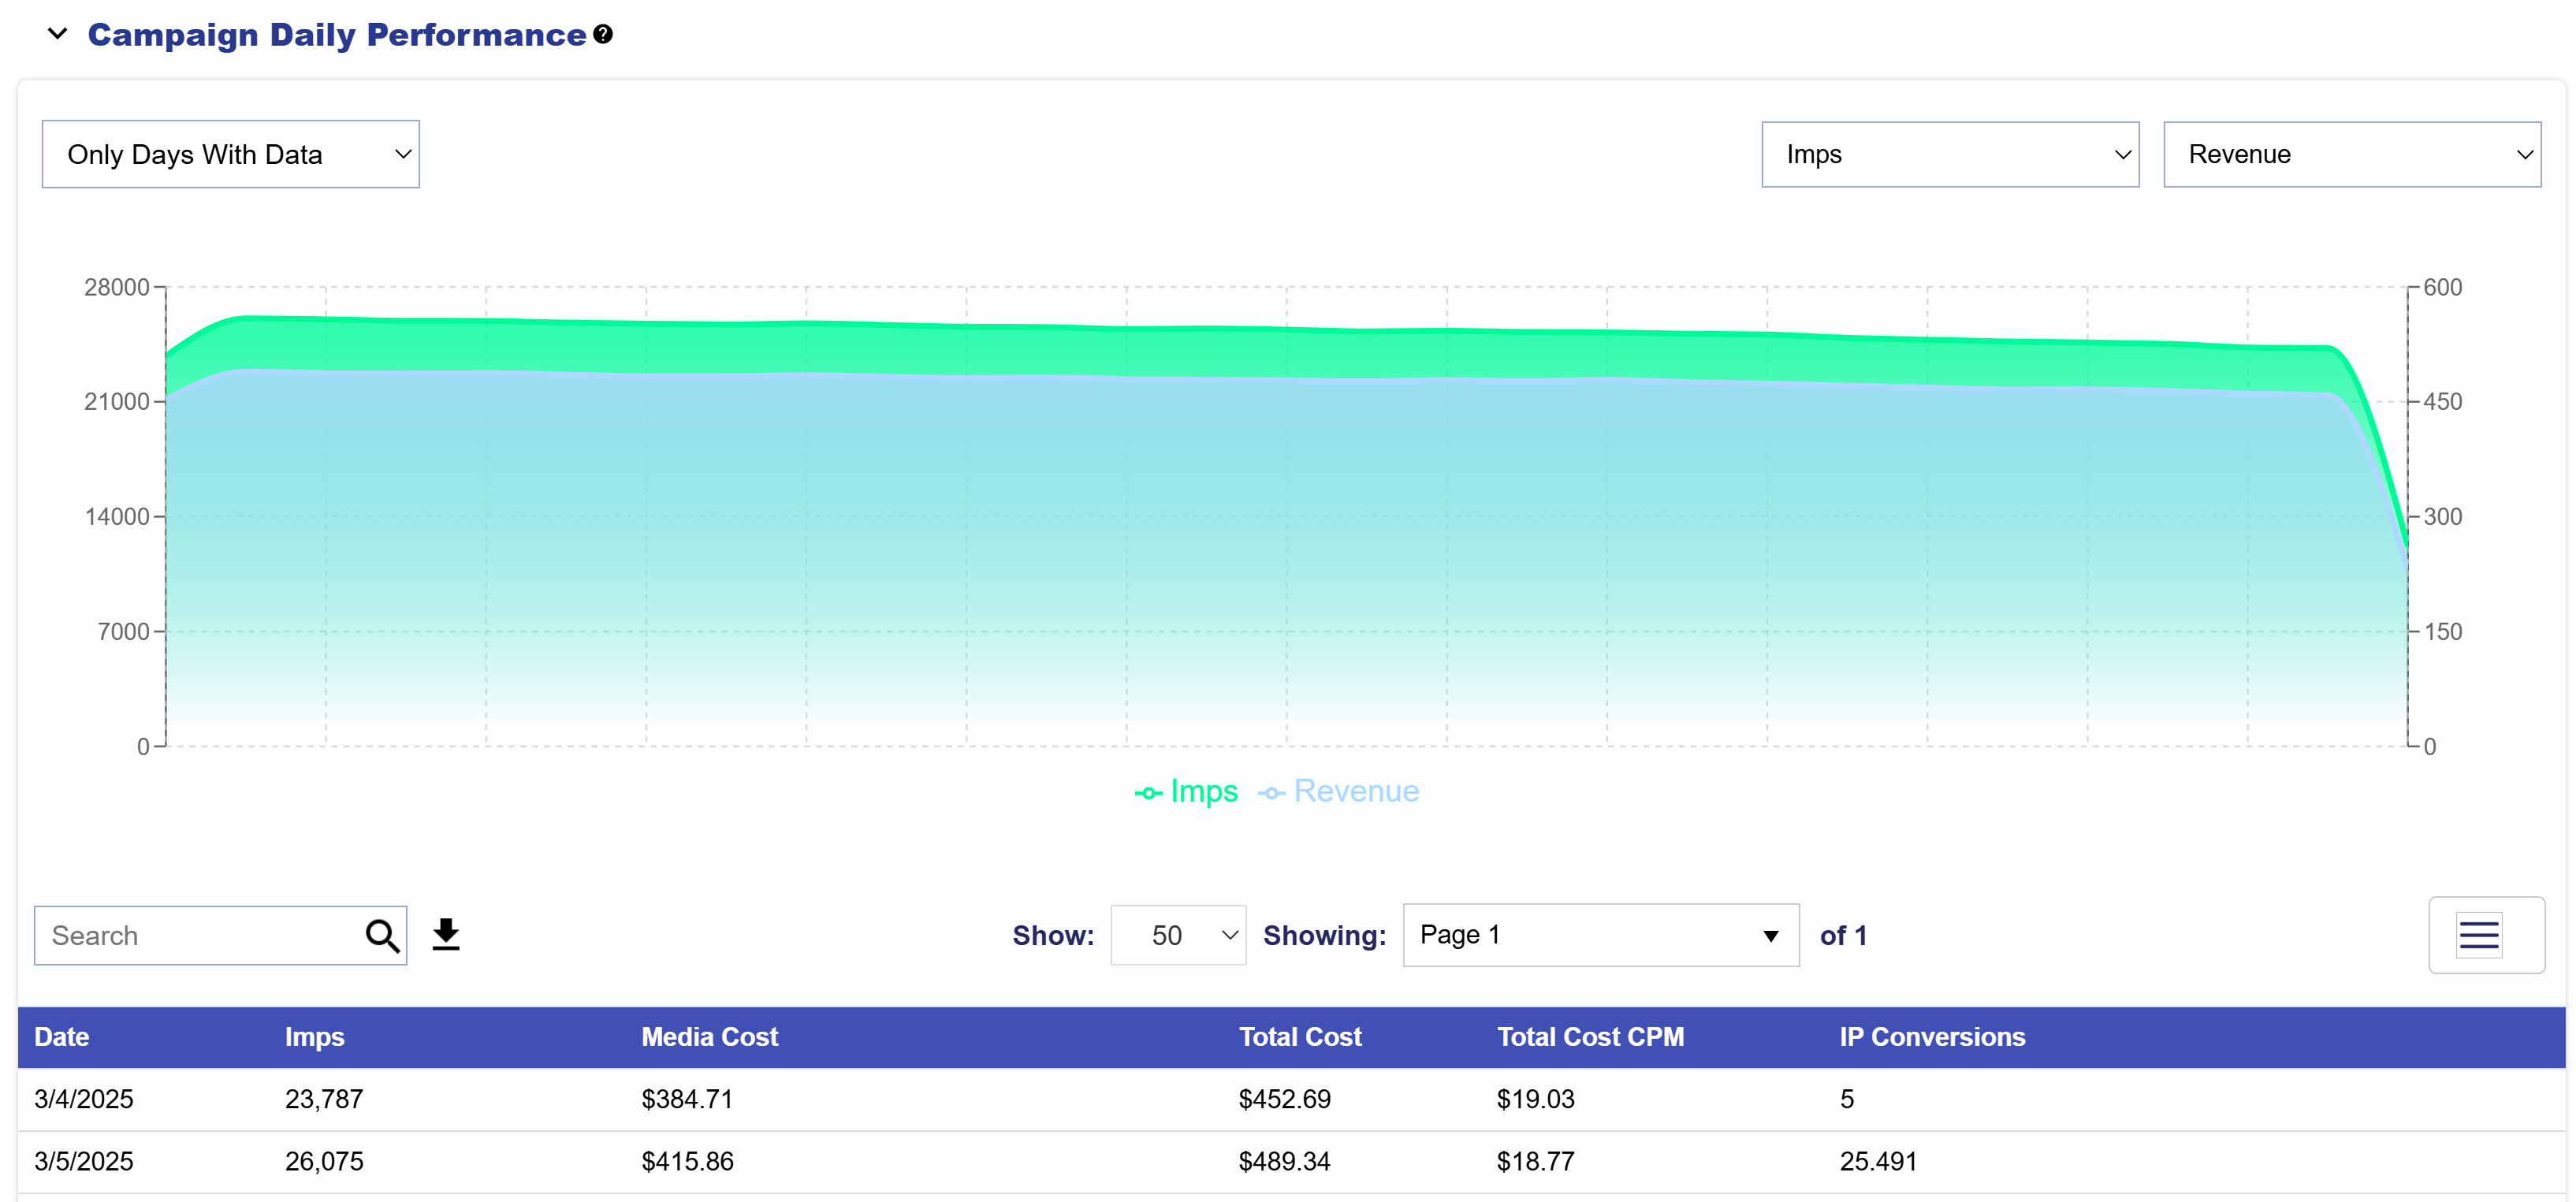
Campaign Daily Performance
The Campaign Daily Performance dropdown section includes a chart and table. The Chart can be filtered to show Only Days with Data or All Days. The Chart compares two selected Metrics against each other. Use the dropdowns in the upper right corner to customize view and discover daily metrics about your Campaign’s performance.
Select from these metrics:
Imps: The total number of impressions the Campaign served within the selected reporting interval.
Media Cost: The total dollar amount spent on the Campaign media before additional fees or margins are applied.
Total Cost: The total Campaign spend, including media costs and any applicable margins or fees.
Total Cost CPM: The total cost per thousand impressions, calculated as (Total Cost / Impressions) x 1,000.
IP Conversions: The number of conversions attributed to users by Campaign who were served an ad and later converted based on IP tracking.
Chrome Convs: The number of conversions recorded specifically from Chrome users.
Clicks: The total number of times users clicked on an ad.
CTR: The percentage of impressions that resulted in clicks, calculated as (Clicks / Impressions) × 100.
CPC: The average cost per click, calculated as (Total Cost / Clicks).
Transparency Score: A score indicating the level of transparency in reporting and data availability.
Foot Traffic ‘Attributed Visitors’: The number of users who visited a physical location after viewing an ad from the Campaign.
Revenue: The total revenue generated from the Campaign.
Media Cost CPM: The media cost per thousand impressions for the Campaign, calculated as (Media Cost / Impressions) × 1,000.
Data Cost: The cost associated with audience data usage for targeting.
Foot Traffic Cost: The cost incurred for tracking and attributing foot traffic conversions.
Credit Card Fee: Any additional fees applied for processing payments via credit card.
Hosting Fee: The fees associated with hosting Campaign assets, such as creative files.
ART Fee: A charge related to the ART usage.
Contextual Fee: The cost associated with using Contextual AI services.
Chalice Fee: A fee related to the Chalice service.
To download a CSV file in the Campaign Daily Performance table, navigate to the Campaign Daily Performance dropdown and locate the search bar in the Table section. On the right-hand side of the search bar, click the download button to export the campaign’s daily performance data as a CSV file. All metrics listed above are available for export. To customize the metrics included in the CSV file, click the three lines in the top right corner of the table and select or deselect the Campaign metrics that matter most to you.
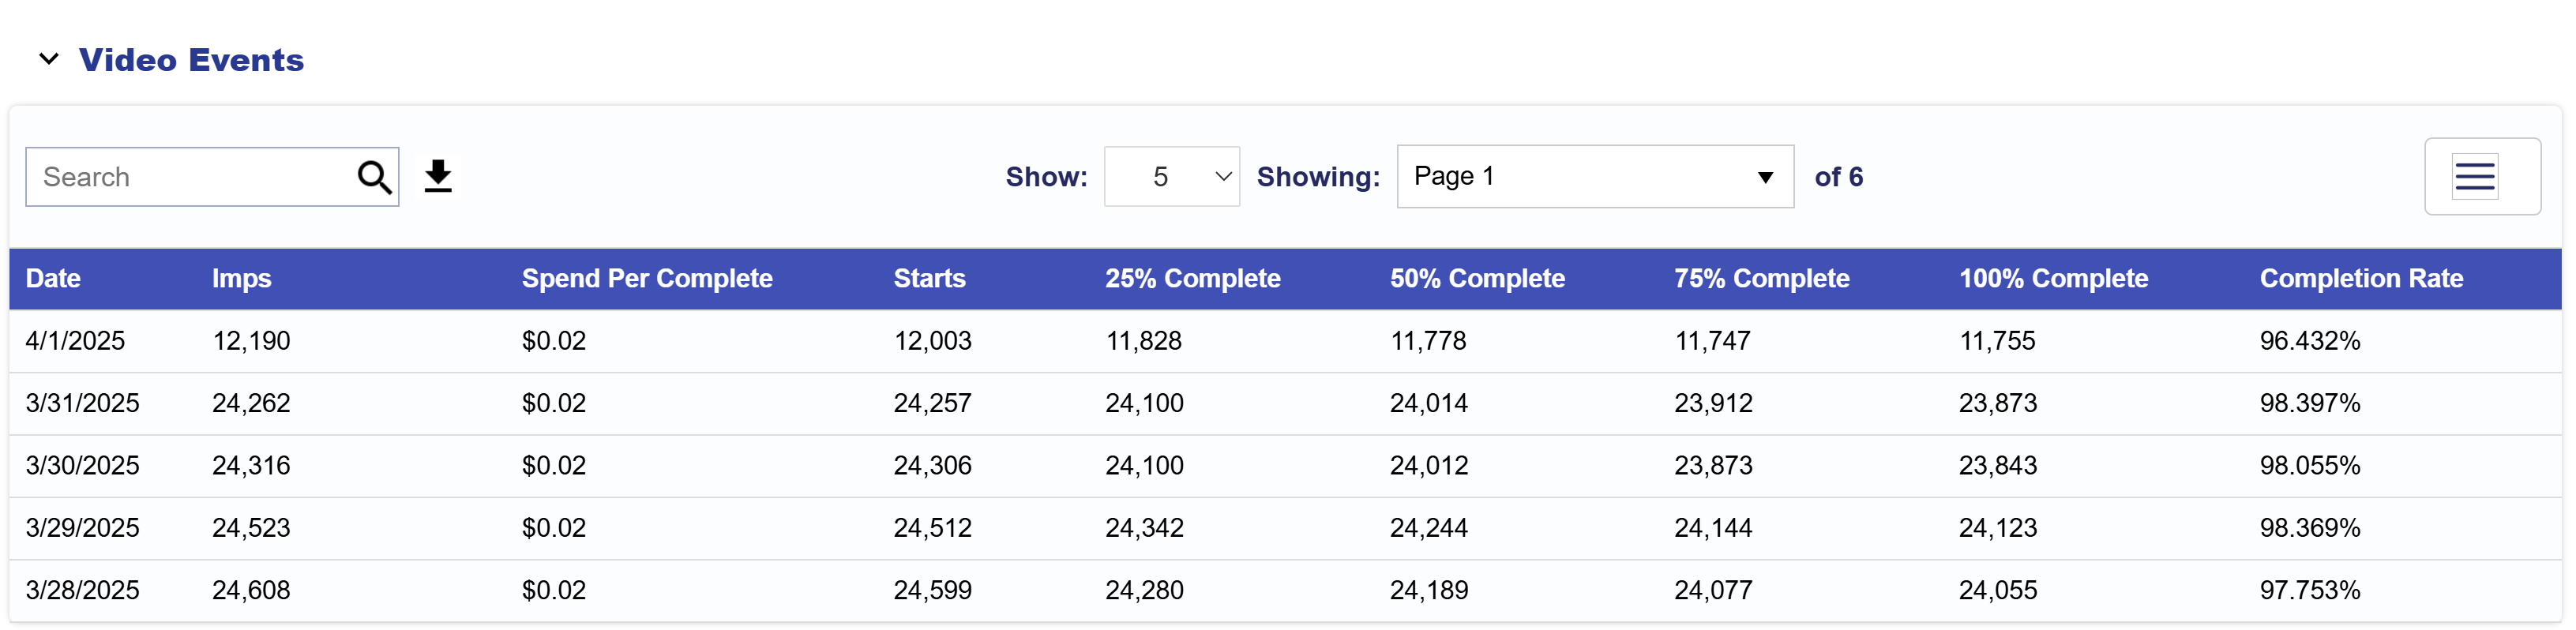
Video Events
The Video Events dropdown section provides a table with detailed video performance metrics for the Campaign, which can be downloaded as a CSV file.
Below is a list of all metrics:
Date: The reporting date for the video event metrics.
Imps: The number of times the video ad was served.
Spend Per Complete: The cost incurred for each fully completed video view
Starts: The number of times the video ad started.
25% Complete: The number of video ads that were watched at least 25% of the way through.
50% Complete: The number of video ads that were watched at least halfway through.
75% Complete: The number of video ads that were watched at least 75% of the way through.
100% Complete: The number of video ads that were watched entirely.
Completion Rate: The percentage of video ads that were fully completed, calculated as (100% Complete ÷ Starts) × 100.
All metrics listed above are available for export. To customize the metrics included in the CSV file, click the three lines in the top right corner of the table and select or deselect the Campaign metrics that matter most to you.