Advertiser Performance Tab
Overview
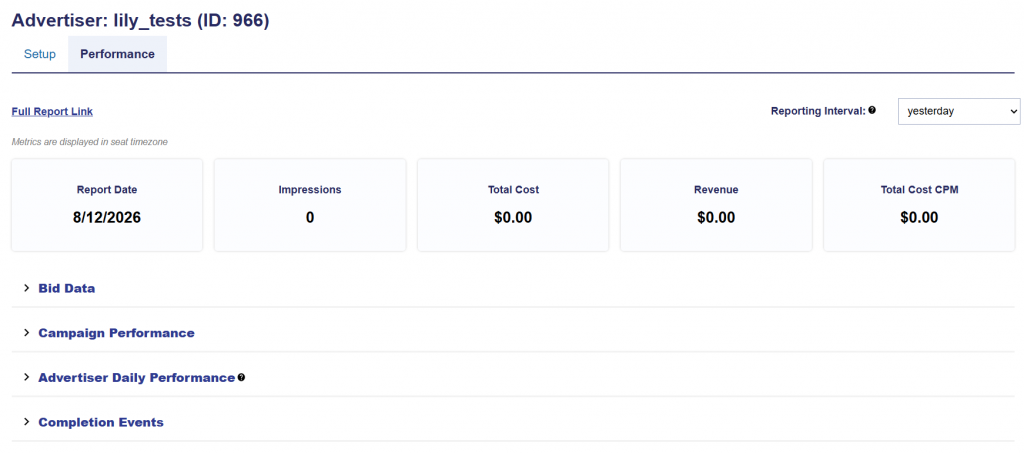
Switching to the Advertiser Performance tab, you can filter the Reporting Interval to adjust the top tiles section. Note that all intervals with the exception of yesterday, include metrics from today. Today’s metrics update hourly and have a 3 hour delay. The metrics include:
- Report Date: Shows the selected report date or date range.
- Impressions: The total number of impressions Advertiser served within the selected reporting interval.
- Total Cost: The total Advertiser spend, including media costs and any applicable fees.
- Revenue: The total Advertiser cost plus any additional advertiser margin.
- Total Cost CPM: The total cost per thousand impressions for the Advertiser, calculated as (Total Cost / Impressions) x 1,000.
This tab provides dropdown insights into Bid Data, Campaign Performance, Advertiser Daily Performance, and Completion Events. See the sections below for more details on each.
Advertiser Tiles
After selecting an Advertiser, users can adjust the Reporting Interval to update the summary metrics displayed at the top of the page. Select from today, yesterday, 7 days, 30 days, month to date, last month, lifetime, or input a custom range.

The following metrics are available:
- Report Date
- Impressions
- Total Cost
- Revenue
- Total Cost CPM
Full Report Link
The Full Report link opens the Reporting > Standard Reporting section and automatically populates the report with the Advertiser you are currently viewing. This allows users to quickly access more detailed reporting for that Advertiser without manually selecting it again.
For more details, see Standard Reporting
Bid Metrics
Bid metrics are displayed on the Advertiser, Campaign, and Line details pages to provide insight into the bid funnel, real-time delivery, and potential issues that may be affecting delivery.
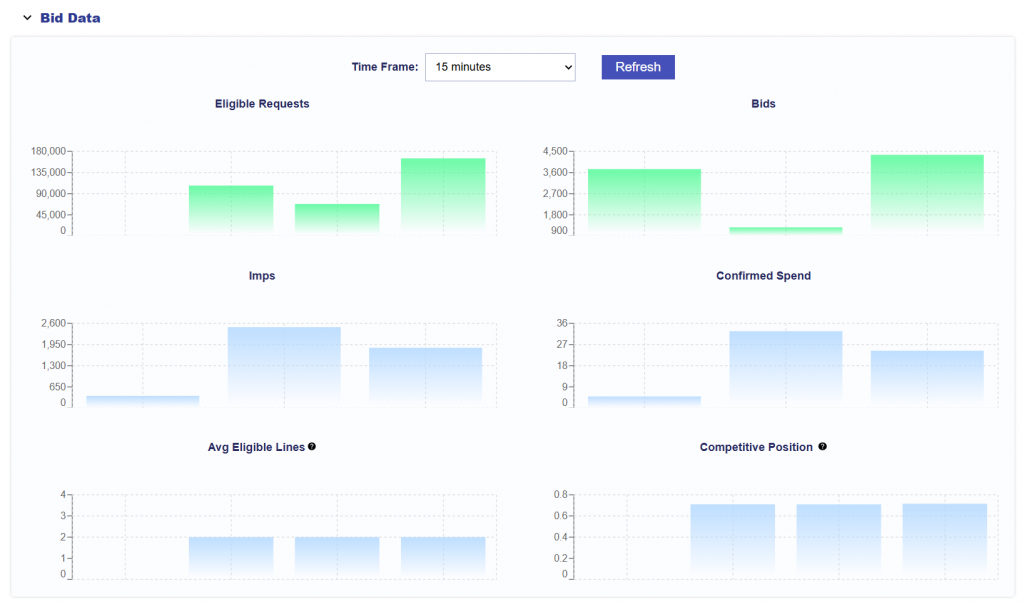
- Time Frame: Select a time frame such as 15 minutes, 1 hour, 12 hours, or 1 day. Data is displayed in 5-minute intervals.
- Eligible Requests: Bid requests that meet the targeting criteria for the Line or Campaign, including settings such as deals, geo targeting, inventory targeting, audiences, and other targeting restrictions. If there are no eligible requests, the selected targeting criteria may be too restrictive or there may be no available inventory matching all criteria. See the Blockers graph and Troubleshooting delivery section below for more information.
- Bids: Bids placed on eligible requests. If a Line or Campaign has eligible requests but is not bidding, additional requirements or settings may be preventing bids from being placed. See the Troubleshooting delivery section below for more information.
- Imps: Confirmed impressions served by the Line or Campaign after winning an auction.
- Confirmed Spend:Confirmed spend generated by impressions served during the selected time frame.
- Avg Eligible Lines: Shows how many lines on average across the platform compete for impressions available to this line. Higher numbers indicate a lot of compeition of eligible inventory.
- Competitive Position: Shows how competitive is this line in the platform. Higher numbers near 1 means that this line’s bid price is very competitive.
Bid/Imp Ratios
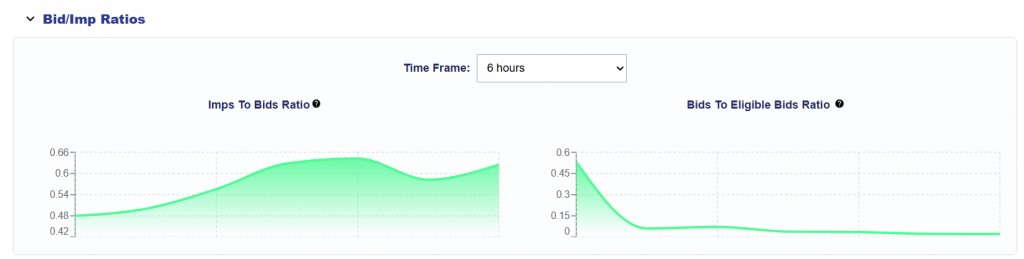
Below the Bid Data section there is the Bid/Imp Ratios data.
- Time Frame: Select different time options such as 6 hours, 12 hours, 24 hours, and 48 hours.
- Imps to Bids Ratio: The ratio of impressions delivered to the number of bids placed. This provides insight into how frequently submitted bids result in won impressions.
- A higher ratio indicates that a larger share of bids are winning and converting into impressions.
- A lower ratio indicates that many bids are being submitted without winning, which may point to factors such as an uncompetitive bid price, auction competition, or deal/inventory conditions.
- Bids to Eligible Bids Ratio: The ratio of bid requests seen which match targeting to the number of bids placed. This provides insight into how frequently the platform bids after a request passes targeting eligibility.
- A higher ratio indicates that the platform is bidding on a larger share of eligible requests.
- A lower ratio indicates that requests are passing targeting eligibility but are frequently being filtered out before a bid is placed. This may point to additional serving requirements such as budget or pacing constraints, creative eligibility, frequency caps, bid requirements, or other bidder-level restrictions. If delivery is being limited by pacing or budget allocation, increasing the Budget Multiplier or enabling Catch Up ASAP may help increase bid volume.
Campaign Performance
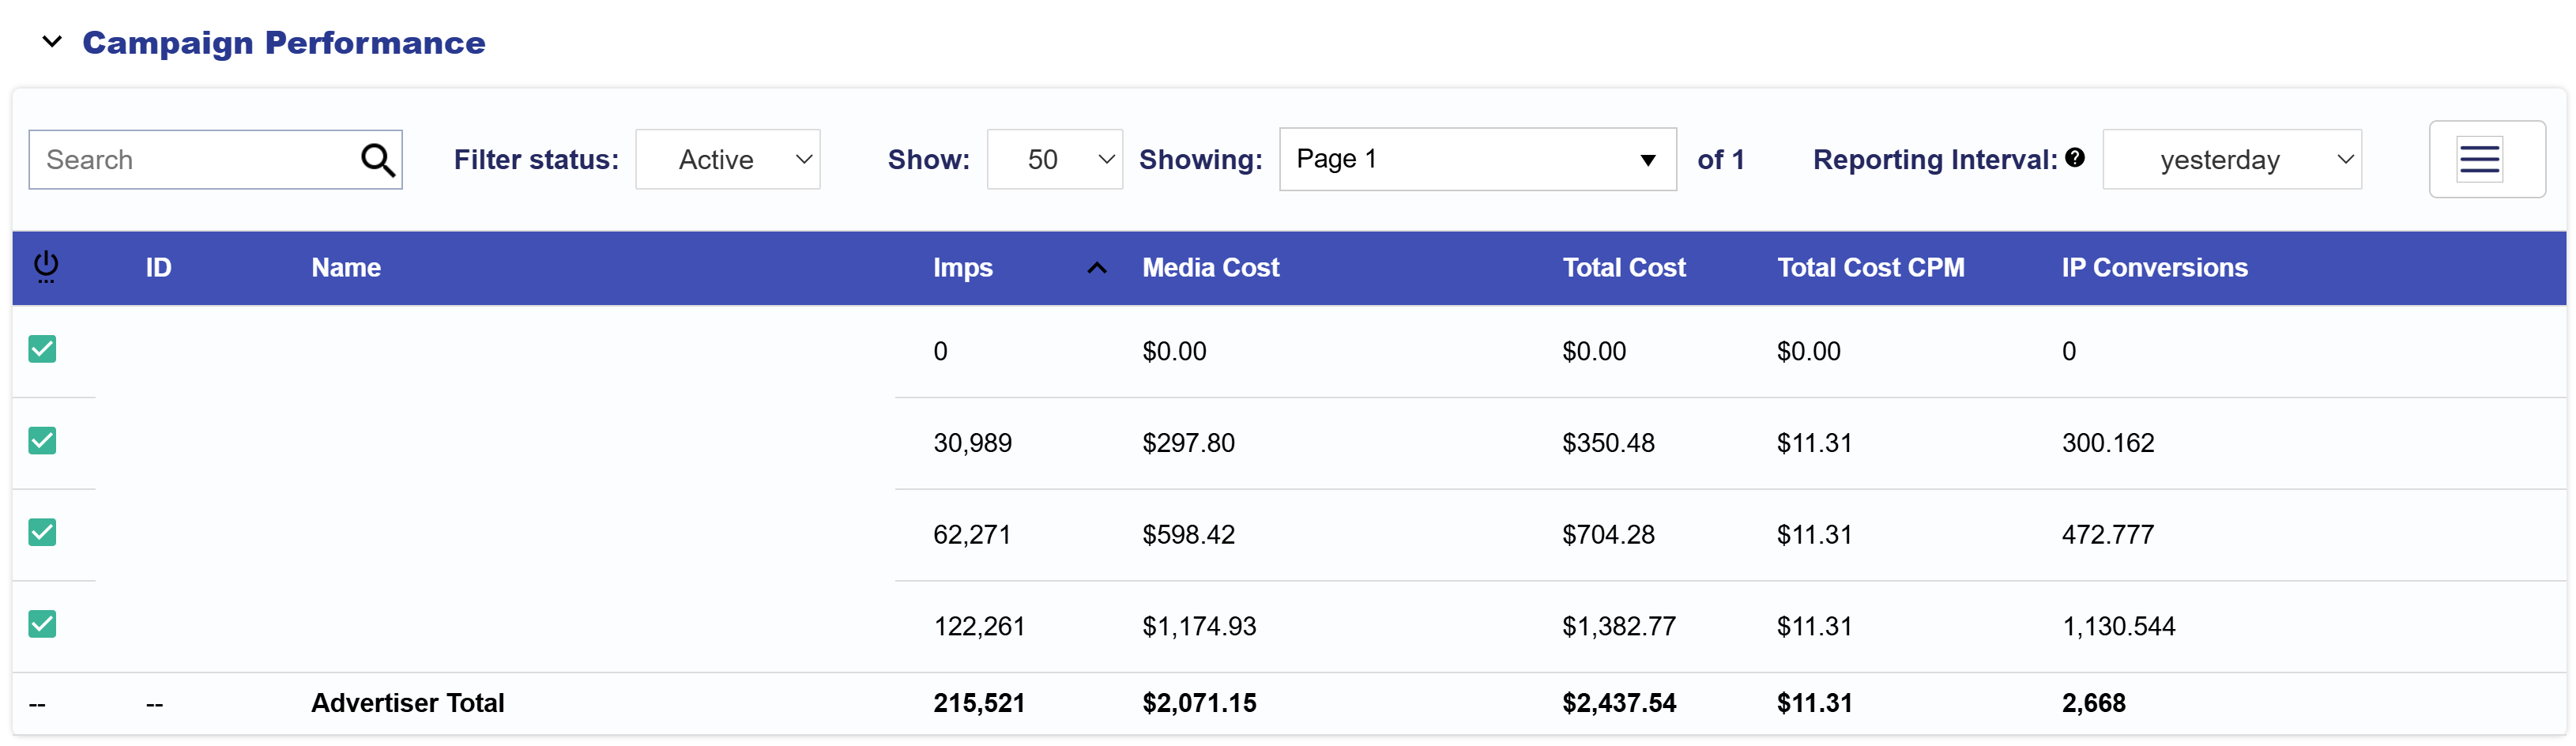
The Campaign Performance section provides a campaign-level view of delivery, performance, costs, conversions, and fees for the Advertiser. Use the Reporting Interval to adjust the time period reflected in the table.
Use the Search bar to find campaigns by keyword or ID. Select the Download button to export the table as a CSV.
- Filter Status: Toggle between Active, Inactive, and All Campaigns.
- Page Size: Adjust the number of campaign rows displayed on each page.
- Total Items: Displays the total number of campaigns included in the current view.
- Page: Displays the current page and total number of available pages.
- Reporting Interval: Updates the performance metrics displayed in the table. All reporting intervals except Yesterday include data from the current day. Today’s metrics update hourly and are subject to an approximately three-hour reporting delay.
- Columns: Select the three-line menu to choose which columns are displayed in the table and customize the view based on your needs.
Campaign Performance Table Columns
The Campaign Performance table can include the following campaign information and performance metrics:
- Status: The current active or inactive status of the Campaign.
- ID: The unique Pontiac Campaign ID.
- Name: The Campaign name.
- Imps: The number of confirmed impressions served during the selected Reporting Interval.
- Media Cost: The cost of media purchased during the selected Reporting Interval, excluding additional fees.
- Total Cost: The total cost incurred during the selected Reporting Interval, including applicable fees.
- Total Cost CPM: Total Cost per 1,000 impressions.
- IP Conversions: The number of conversions attributed using IP-based attribution during the selected Reporting Interval.
- Chrome Convs: The number of Chrome-attributed conversions recorded during the selected Reporting Interval.
- Clicks: The number of recorded clicks during the selected Reporting Interval.
- CTR: Click-Through Rate, calculated as Clicks divided by Impressions.
- CPC: Cost per Click, calculated using Total Cost divided by Clicks.
- Transparency Score: The Campaign’s transparency score for the selected Reporting Interval.
- Foot Traffic ‘Attributed Visitors’: The number of visitors attributed to campaign exposure through Foot Traffic measurement.
- Revenue: The Total Cost plus Advertiser Margin generated during the selected Reporting Interval.
- Media Cost CPM: Media Cost per 1,000 impressions.
- Data Cost: Costs associated with data used for campaign targeting.
- Foot Traffic Cost: Costs associated with Foot Traffic measurement.
- Credit Card Fee: Credit card processing fees associated with campaign spend, when applicable.
- Hosting Fee: Costs associated with creative hosting, when applicable.
- ART Fee: Costs associated with ART audience usage, when applicable.
- Contextual Fee: Costs associated with contextual targeting, when applicable.
- Chalice Fee: Costs associated with Chalice optimization, when applicable.
- VCR: Video Completion Rate, representing the percentage of video impressions that were viewed to completion.
Advertiser Daily Performance
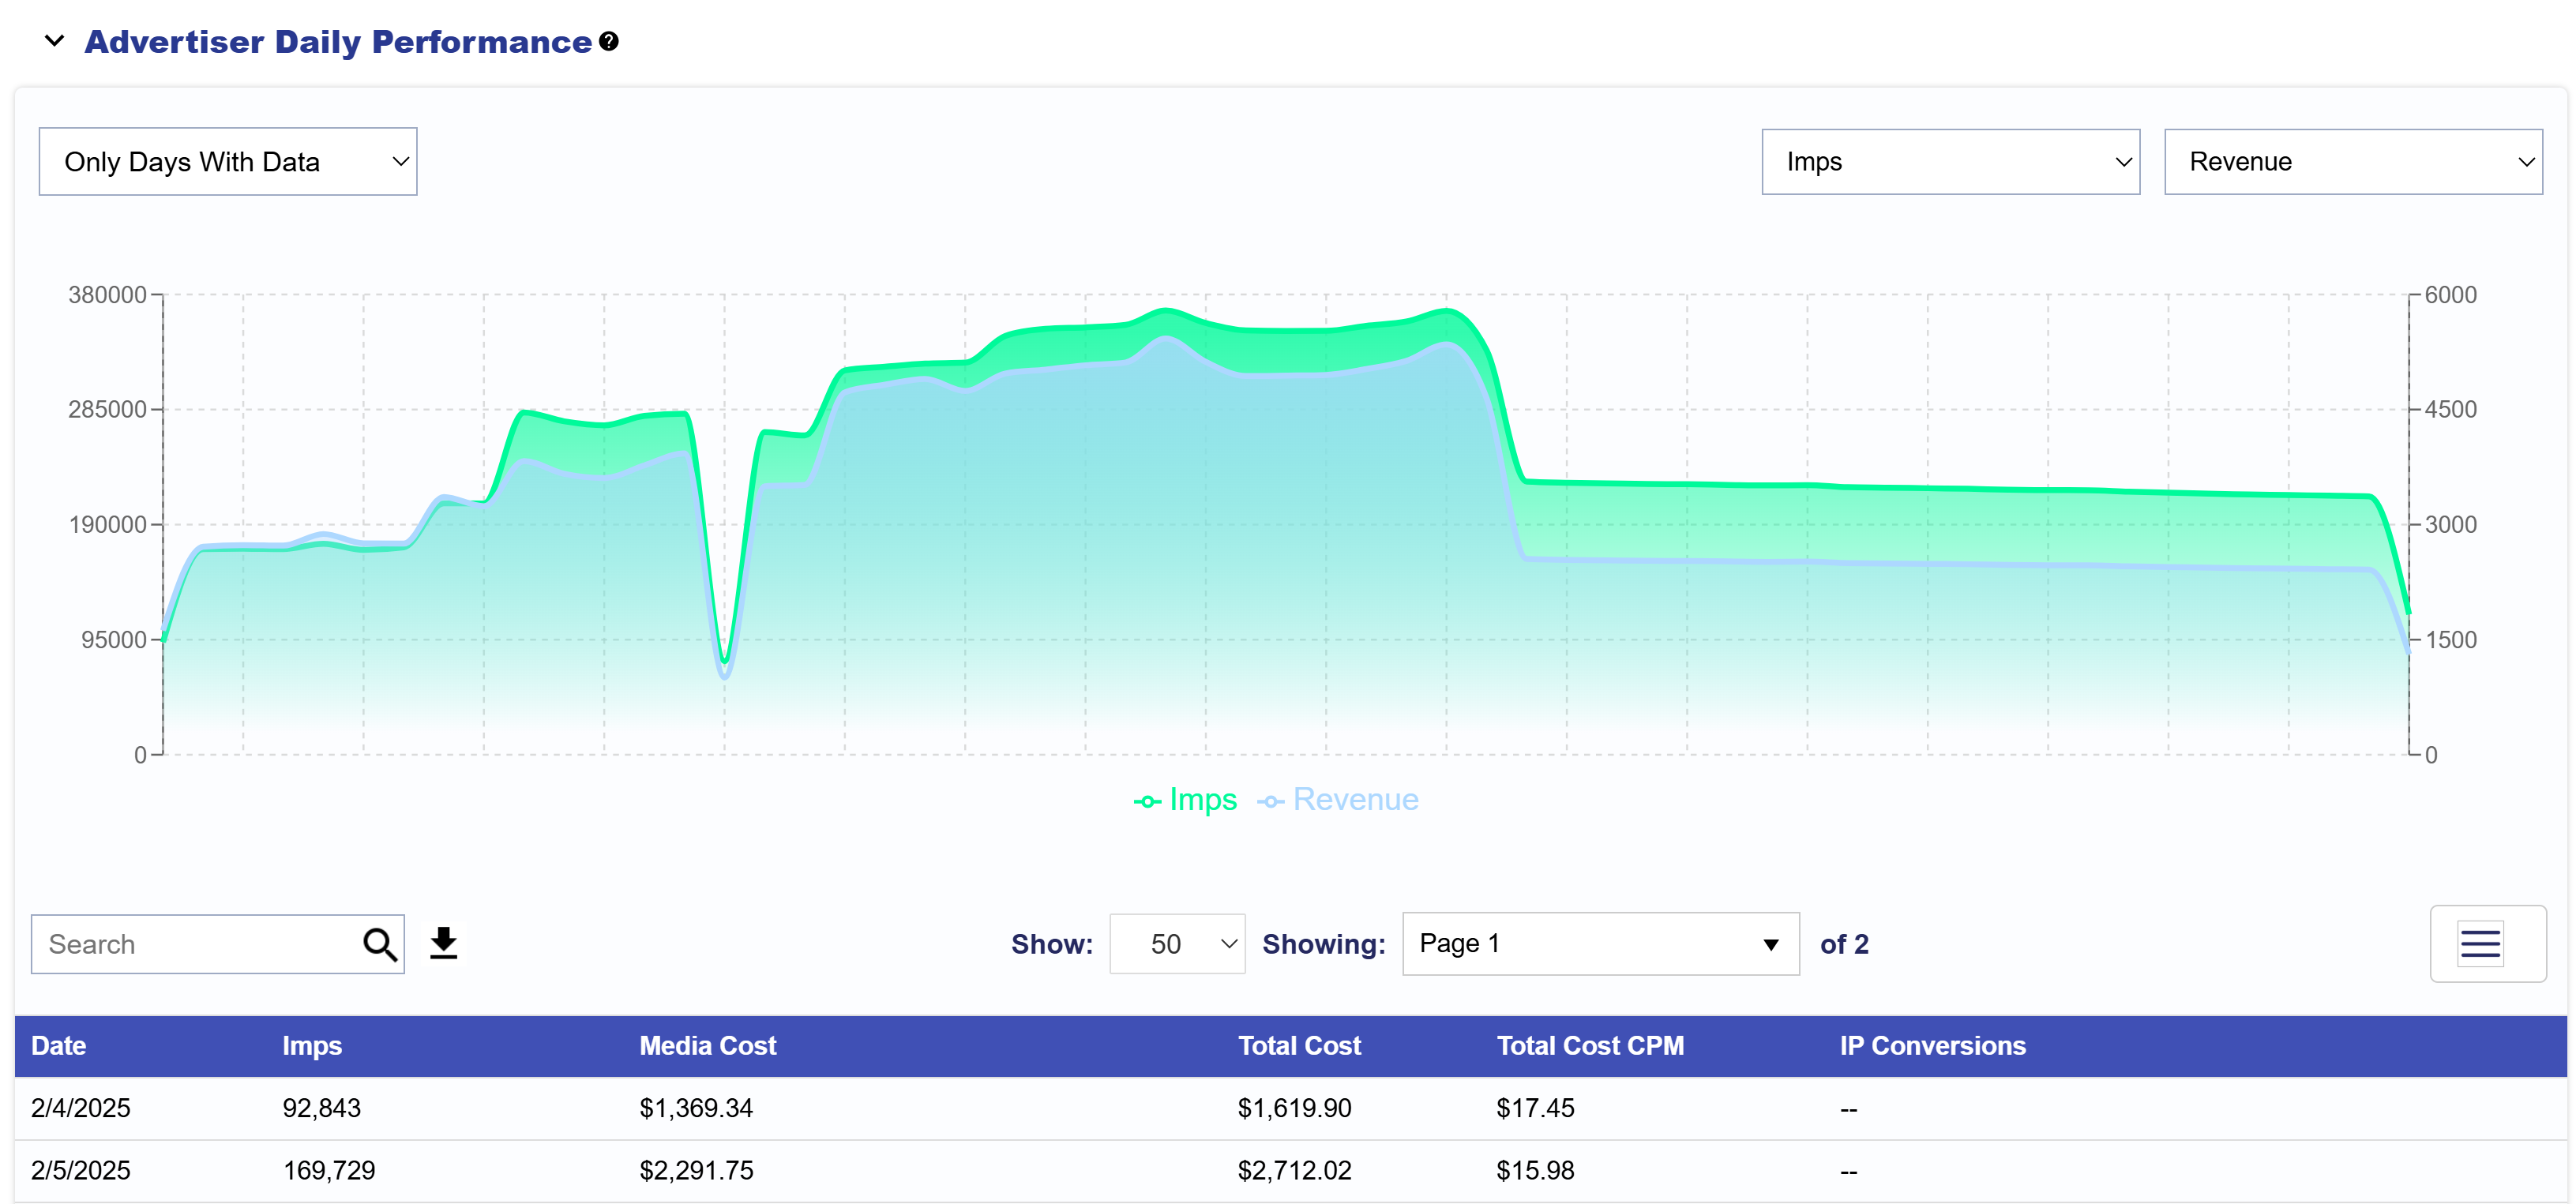
The Advertiser Daily Performance section provides a day-by-day view of the Advertiser’s delivery, performance, costs, conversions, and fees. Expand the section to view both the Daily Performance Chart and Daily Performance Table.
Daily Performance Chart
The chart allows users to compare two selected performance metrics over time to identify trends and changes in Advertiser performance.
Use the metric dropdowns in the upper-right corner of the chart to select the two metrics you want to compare.
The chart can also be filtered by:
- Only Days with Data: Displays only dates where performance data was recorded.
- All Days: Displays all dates within the selected Reporting Interval, including dates with no recorded activity.
Daily Performance Table
The Daily Performance table provides the same Advertiser performance data broken out by individual day.
Select the Download button to export the table as a CSV.
- Page Size: Adjust the number of daily performance rows displayed on each page.
- Total Items: Displays the total number of dates included in the current view.
- Page: Displays the current page and total number of available pages.
- Columns: Select the three-line menu to choose which columns are displayed in the table and customize the view based on your needs.
Daily Performance Table Columns
The Advertiser Daily Performance table can include the following daily performance metrics:
- Date: The date associated with the performance metrics.
- Imps: The number of confirmed impressions served on that date.
- Media Cost: The cost of media purchased on that date, excluding additional fees.
- Total Cost: The total cost incurred on that date, including applicable fees.
- Total Cost CPM: Total Cost per 1,000 impressions.
- IP Conversions: The number of conversions attributed using IP-based attribution.
- Chrome Convs: The number of Chrome-attributed conversions recorded.
- Clicks: The number of recorded clicks.
- CTR: Click-Through Rate, calculated as Clicks divided by Impressions.
- CPC: Cost per Click, calculated using Total Cost divided by Clicks.
- Transparency Score: The Advertiser’s transparency score for that date.
- Foot Traffic ‘Attributed Visitors’: The number of visitors attributed to advertising exposure through Foot Traffic measurement.
- Revenue: The Total Cost plus Advertiser Margin generated on that date.
- Media Cost CPM: Media Cost per 1,000 impressions.
- Data Cost: Costs associated with data used for campaign targeting.
- Foot Traffic Cost: Costs associated with Foot Traffic measurement.
- Credit Card Fee: Credit card processing fees associated with spend, when applicable.
- Hosting Fee: Costs associated with creative hosting, when applicable.
- Art Fee: Costs associated with ART audience usage, when applicable.
- Contextual Fee: Costs associated with contextual targeting, when applicable.
- Chalice Fee: Costs associated with Chalice optimization, when applicable.
Completion Events
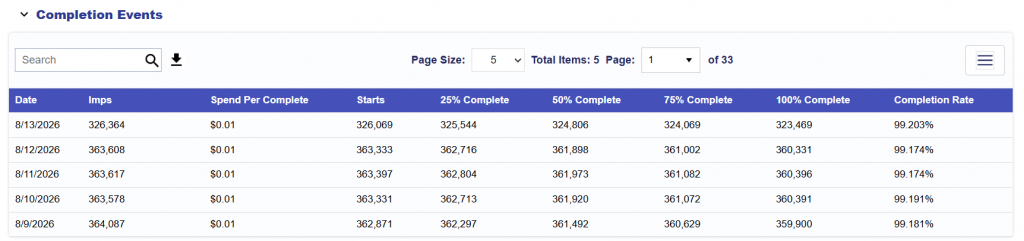
The Completion Events dropdown section provides detailed completion performance for video and audio campaigns with creatives that have a duration. The table shows how users progress through the creative, from the start through completion, and can be used to evaluate engagement and completion efficiency.
Select the Download button to export the table as a CSV.
- Page Size: Adjust the number of rows displayed on each page.
- Total Items: Displays the total number of rows included in the current view.
- Page: Displays the current page and total number of available pages.
- Columns: Select the three-line menu to choose which columns are displayed in the table and customize the view based on your needs.
Completion Events Table Columns
- Date: The date associated with the completion event metrics.
- Imps: The number of confirmed impressions served.
- Spend Per Complete: The average spend for each completed creative.
- Starts: The number of times the creative began playing.
- 25% Complete: The number of plays that reached 25% of the creative duration.
- 50% Complete: The number of plays that reached 50% of the creative duration.
- 75% Complete: The number of plays that reached 75% of the creative duration.
- 100% Complete: The number of plays that reached the end of the creative.
- Completion Rate: The percentage of started plays that reached 100% completion.